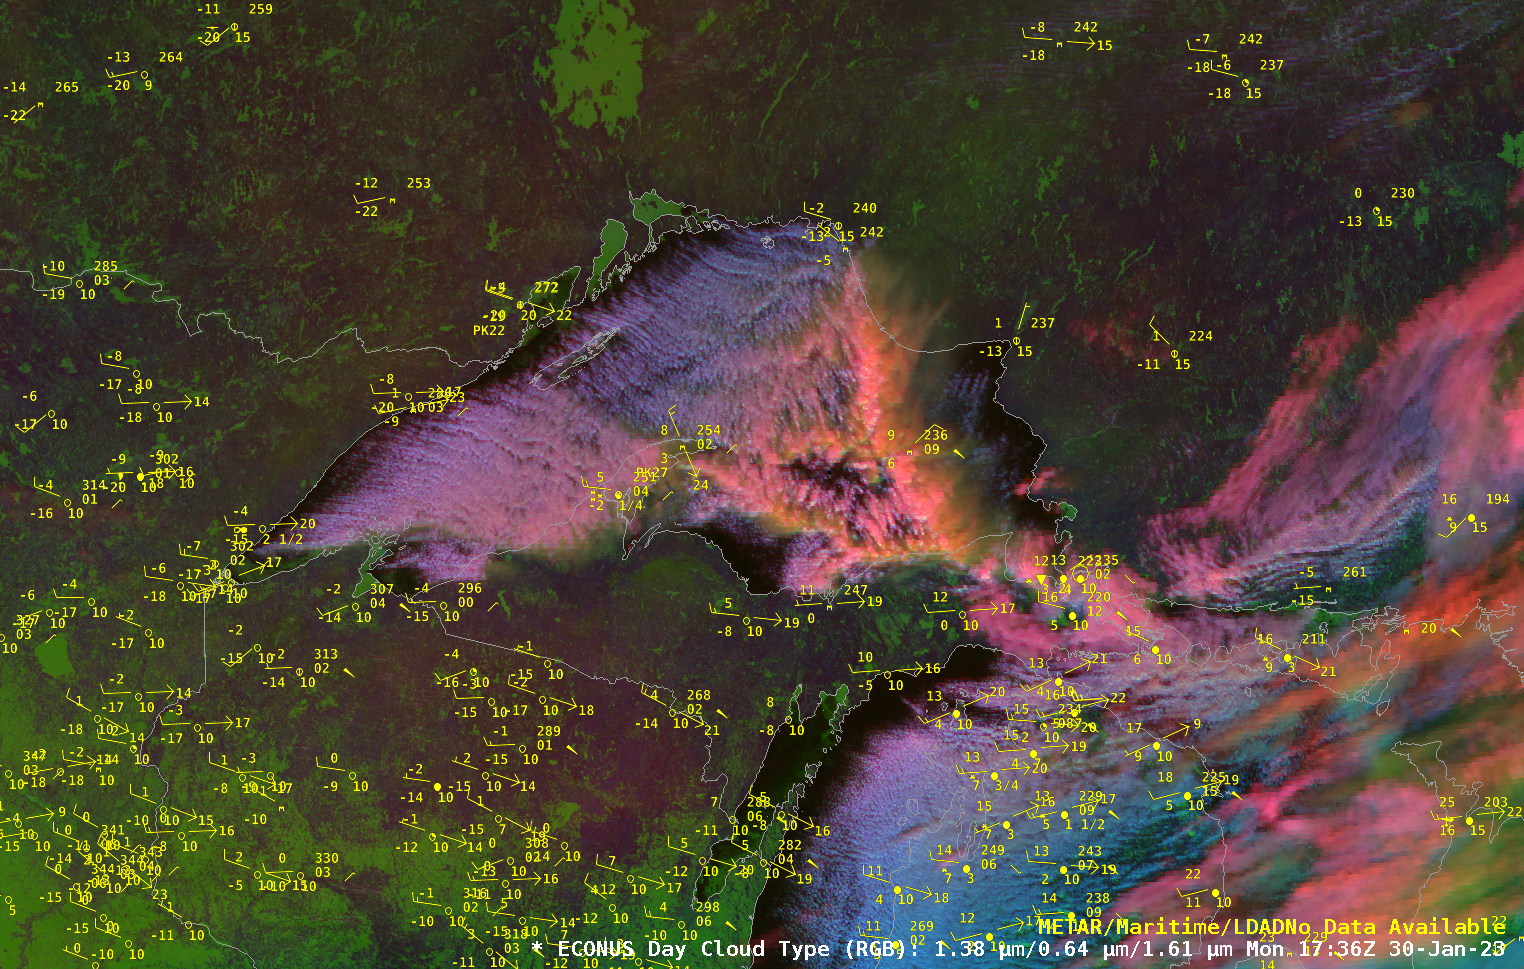
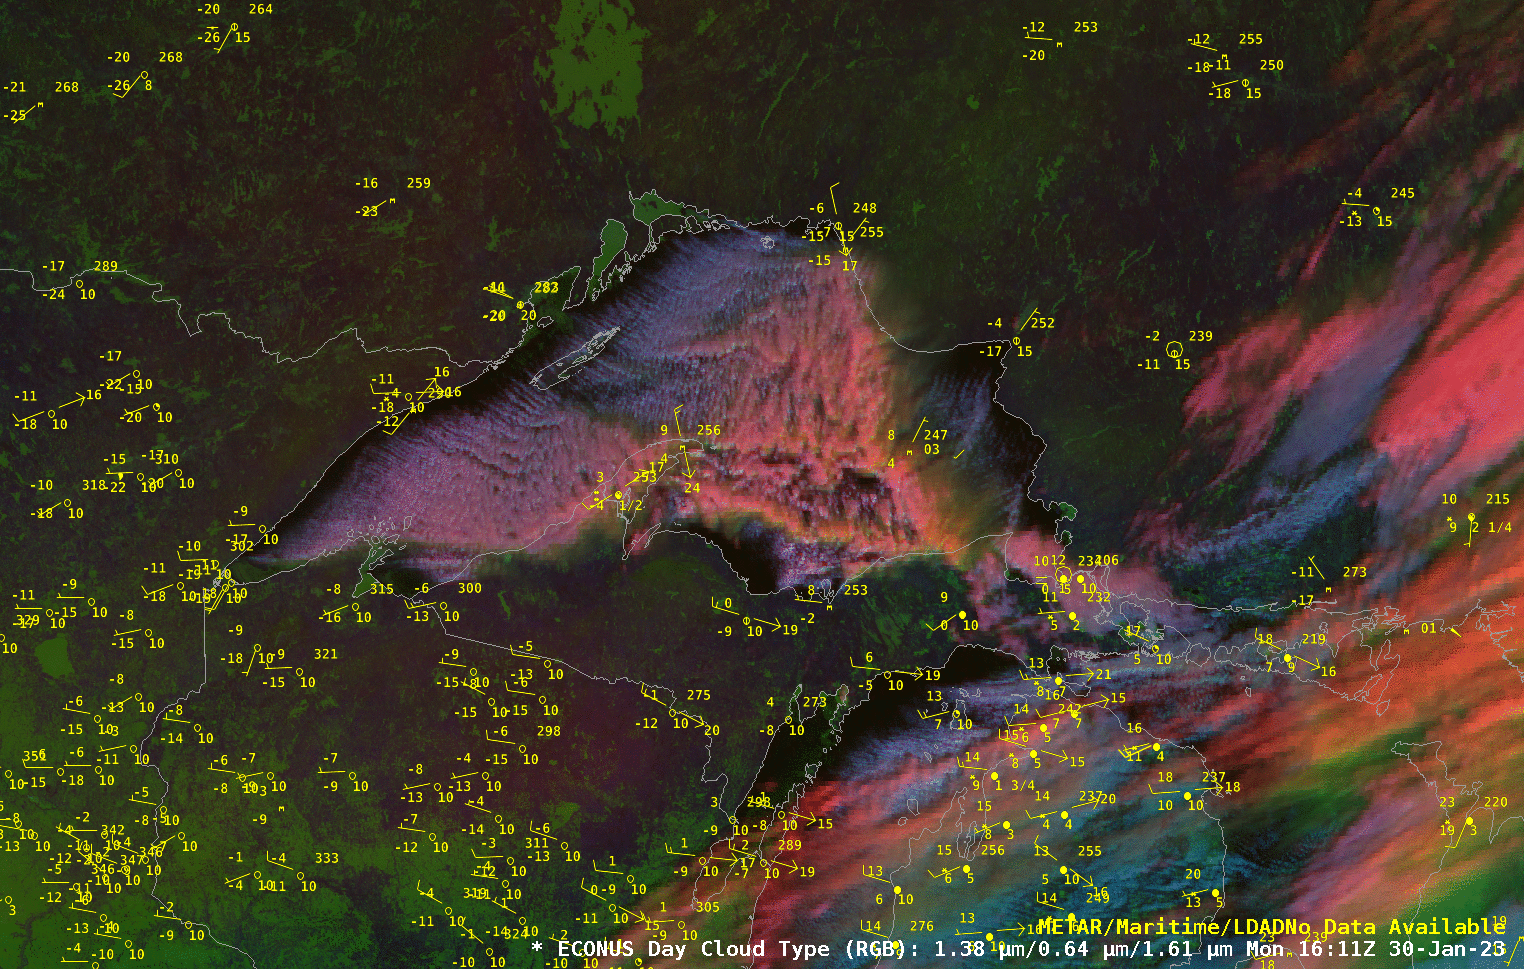
An animation of the Day Cloud Type RGB over Lake Superior on 30 January 2023, above, shows two prominent features: persistent lake-effect bands oriented west-northwest to east-southeast over the western four-fifths of the Lake (station KCMX on the Keewenaw peninsula, for example, observed heavy snow during this animation), and a more north-south oriented convergence band that extends from the eastern Upper Peninsula of Michigan towards Marathon, ON. Note the northeast wind observation on Caribou Island in eastern Lake Superior.
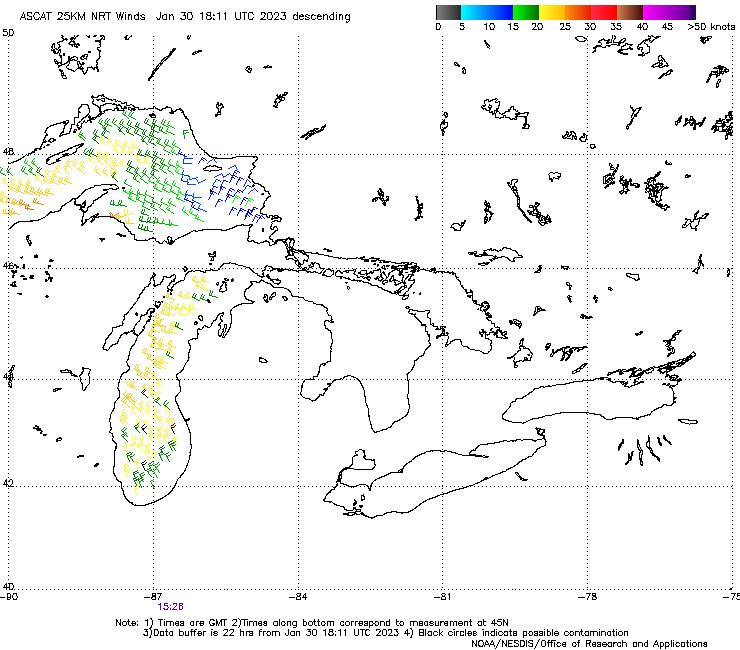
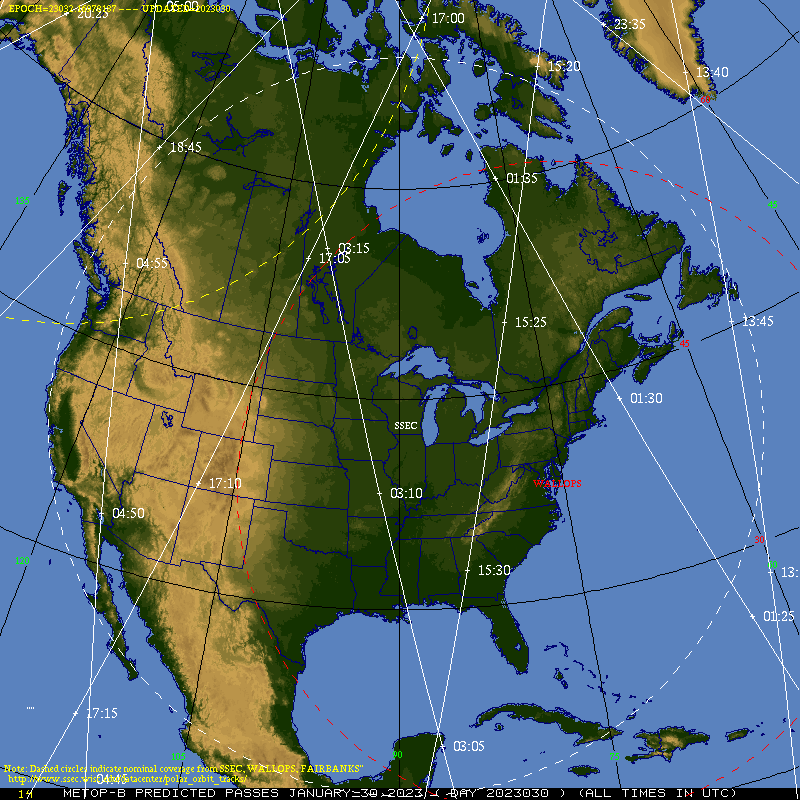
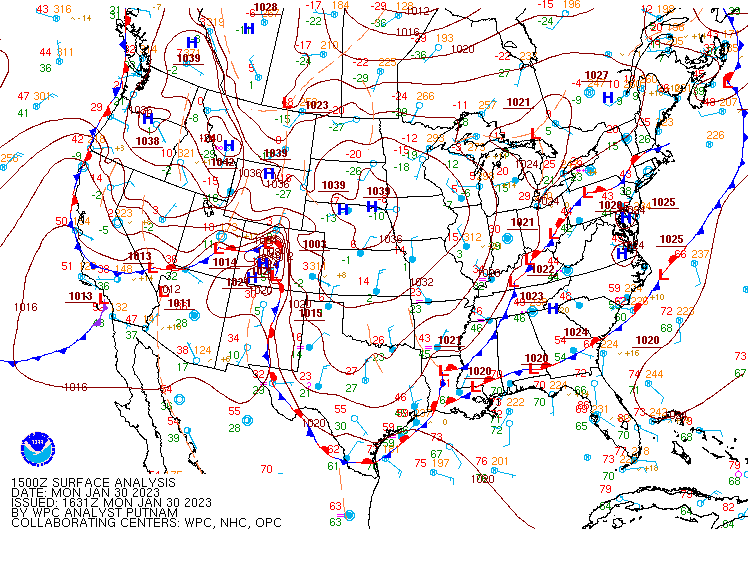
Advanced Scatterometer (ASCAT) winds from Metop-B (that had a timely descending overpass to view Lake Superior), shown below, neatly show the convergent wind field. (Imagery from this website). A 1500 UTC surface analysis (here) shows a trough of low pressure over extreme eastern Lake Superior consistent with the region of northeast winds.
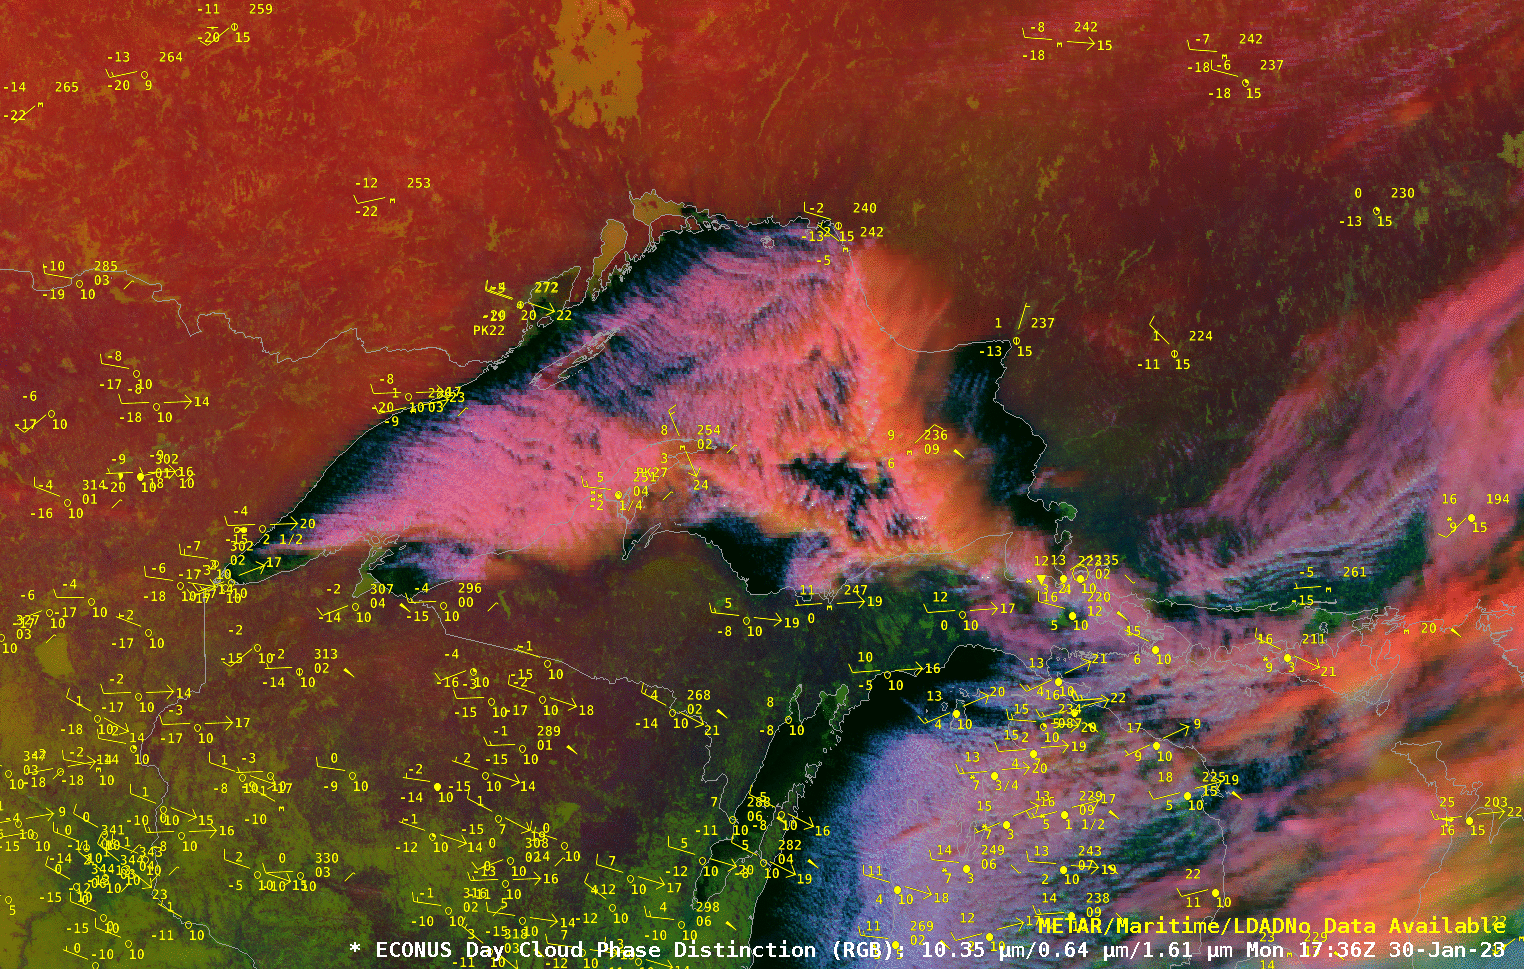
Note that the RGB used above is the Day Cloud Type RGB (rather than the perhaps more well-known Day Cloud Phase Distinction). In very cold airmasses, the ‘red’ band of the Day Cloud Phase Distinction RGB loses the ability to discriminate between the cold ground and higher cloud tops that might have a temperature similar to the Earth’s surface. The Day Cloud Type RGB uses Band 4 (the so-called ‘Cirrus Band’) rather than Band 13. The toggle below compares Day Cloud Type and Day Cloud Phase Distinction RGBs at 1736 UTC. Day Cloud Type is doing a better job on this day in discriminating between the different cloud tops in the Lake-Effect bands and in the convergence band.
Thanks to Paul Ford, ECCC, for drawing our attention to this interesting convergent band over Lake Superior!
View only this post Read Less


