This website works best with a newer web browser such as Chrome, Firefox, Safari or Microsoft
Edge. Internet Explorer is not supported by this website.
GOES-18 (GOES-West) SO2 RGB and Ash RGB images (above) showed the southward drift of a pair of volcanic clouds produced by an eruption of Mount Shishaldin that began at 0908 UTC on 14 July 2023. The initial higher-altitude volcanic cloud likely contained moderate concentrations of SO2 (denoted by brighter shades of yellow in... Read More
GOES-18 SO2 RGB and Ash RGB images, 0900-1400 UTC [click to play animated GIF | MP4]
GOES-18 (GOES-West)SO2 RGB and Ash RGB images (above) showed the southward drift of a pair of volcanic clouds produced by an eruption of Mount Shishaldin that began at 0908 UTC on 14 July 2023. The initial higher-altitude volcanic cloud likely contained moderate concentrations of SO2 (denoted by brighter shades of yellow in the SO2 RGB images) — while the second lower-altitude volcanic cloud likely contained small concentrations of ash (shades of pink in the Ash RGB images).
The difference between the 2 volcanic clouds was evident in a toggle between SO2 RGB and Ash RGB images at 1200 UTC (below).
GOES-18 SO2 RGB and Ash RGB images at 1200 UTC [click to enlarge]
In a toggle between Suomi-NPP VIIRS Day/Night Band (0.7 µm) and Infrared Window (11.45 µm) images valid at 1245 UTC (below), the bright glow of hot lava at the volcano summit could be seen in the Day/Night Band image — while the initial volcanic cloud had largely dissipated, and was no longer exhibiting cold infrared brightness temperatures.
Suomi-NPP VIIRS Day/Night Band (0.7 µm) and Infrared Window (11.45 µm) images valid at 1245 UTC [click to enlarge]
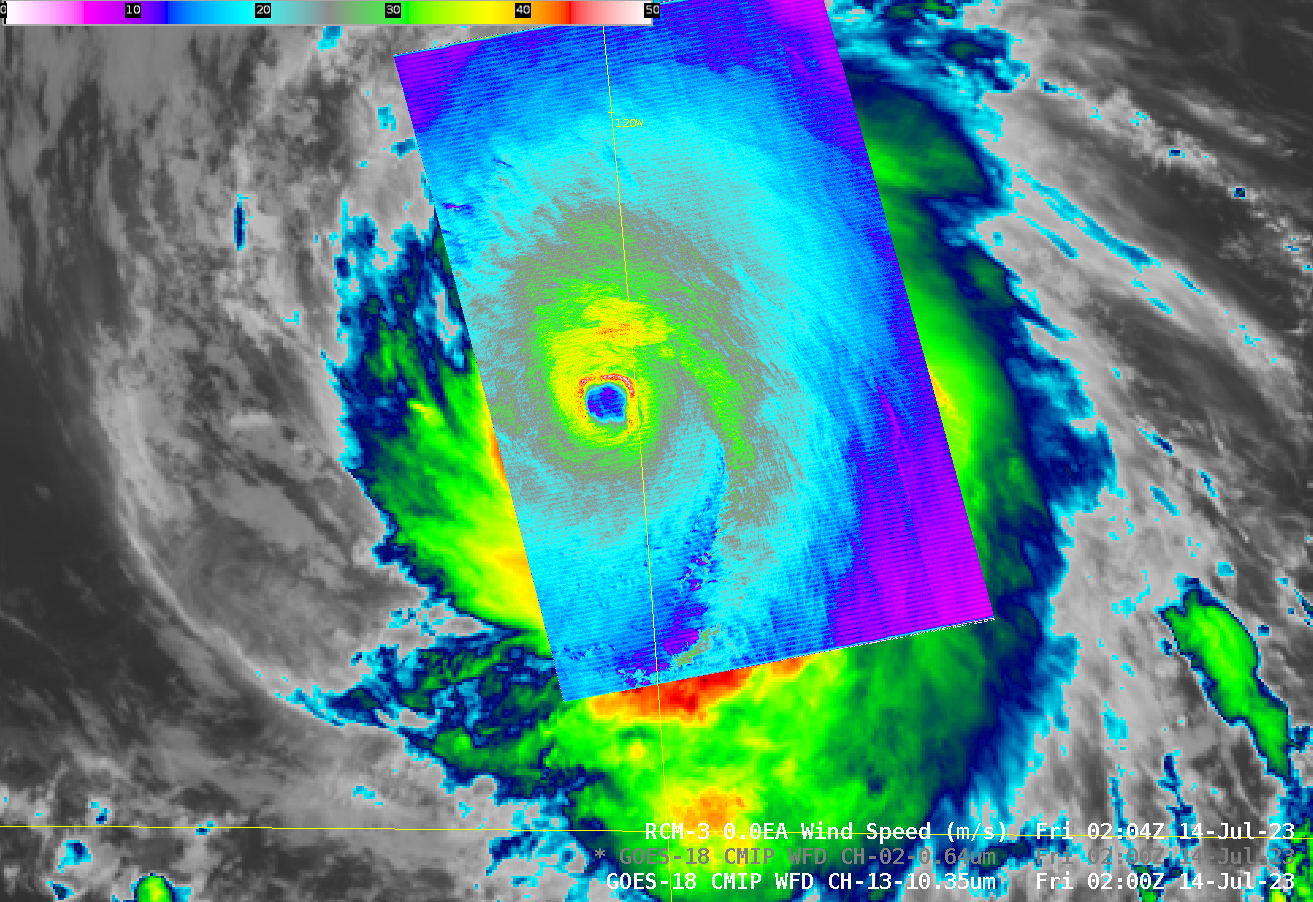
Pacific Hurricane Calvin was sampled by Radar Constellation Mission #3 (RCM-3) shortly after 0200 UTC on 14 July 2023. The SAR winds (click here to access a JAOTech article on this subject!) show strong winds surrounding a not-quite-circular closed eye, with a region of strong winds extending in a curved... Read More
Pacific Hurricane Calvin was sampled by Radar Constellation Mission #3 (RCM-3) shortly after 0200 UTC on 14 July 2023. The SAR winds (click here to access a JAOTech article on this subject!) show strong winds surrounding a not-quite-circular closed eye, with a region of strong winds extending in a curved band to the east and south of the eye (an analysis of the SAR winds by quadrant is available here). Note in the slider above how that curved band also has a signal in the GOES-18 Band 13 infrared (10.3 µm) brightness temperatures. GOES-18 Visible imagery (Band 2, 0.64 µm), below, just before the SAR pass and up through sunset, so strong convection bubbling around the eye — and strong convection in the region southeast of the eye where SAR data shows strong winds. Band 13 imagery shows a similar pattern.
GOES-18 Visible Imagery (band 2, 0.64 µm), 0120 – 0210 UTC on 14 July 2023 (Click to enlarge)
1-minute GOES-18 Infrared images (Band 13, 10.3 µm, top) and Visible images (Band 2, 0.64 µm, bottom) from 2200 UTC on 13 July to 0200 UTC on 14 July (courtesy Scott Bachmeier, CIMSS) [click to play animated GIF | MP4]
1-minute Mesoscale Domain Sector GOES-18 Infrared and Visible images during the 4-hour period from 2200 UTC on 13 July to 0200 UTC on 14 July (above) showed the evolution of deep convection within the eyewall of Calvin.
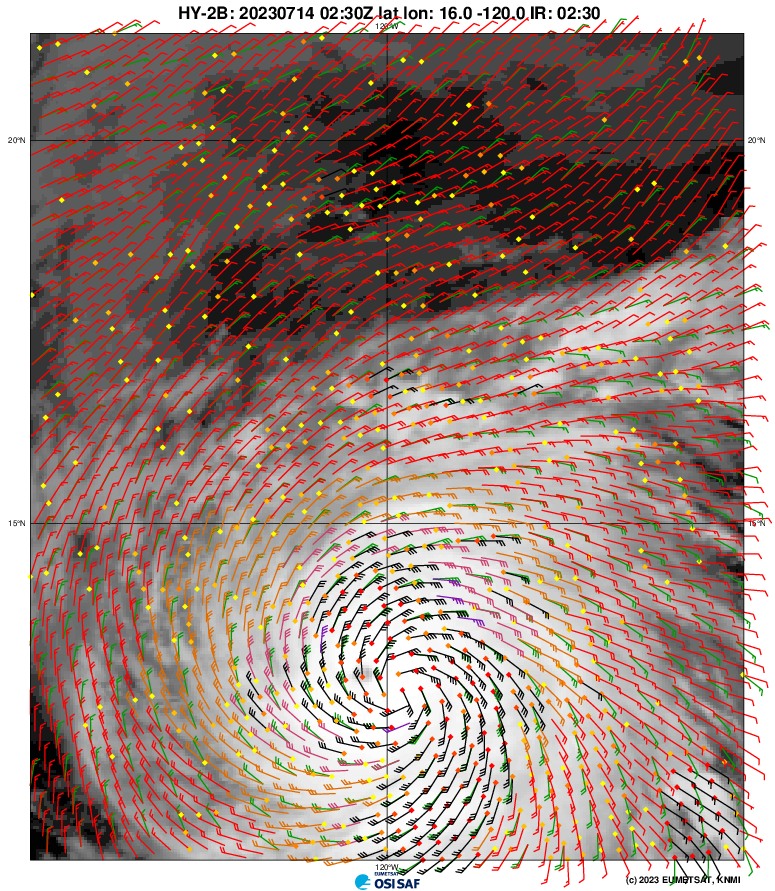
Other microwave products (beyond SAR) also showed the structure of this storm. For example, 0230 UTC HY2B scatterometry data, below (ASCAT observations from MetopB and MetopC did not sample Calvin’s eye on 13-14 July 2023), taken from this website, show a closed circulation — and also that same extension of strong winds in a curved band east and south of the storm center.
HY-2B Scatterometry winds over Calvin, 0230 UTC o 14 July 2023 (Click to enlarge)
AMSU-B Imagery (89 GHz) at 0521 UTC on 14 July 2023, shown below (from this website), also shows the band of strong convection curving east and south of the eye. The AMSU-A cross-section through the eye (here) shows warm temperature anomalies above the eye.
AMSU-B 89 GHz brightness temperatures, 0521 UTC on 14 July 2023 (Click to enlarge)
Imagery from the SSEC Tropical website, shown below, shows the storm moving over progressively cooler water in the next several days. Shear values at present are low. Long-range models continue to show a weakened system (and its moisture) moving over the Hawai’ian islands in the middle of next week. Therefore, interests in Hawai’i should closely monitor the progress of this storm.
Past and future path of Hurricane Calvin with SSTs and 200-850 mb shear (Click to enlarge)
RCM-3 overflew Calvin just after 1400 UTC on 14 July as well, as shown in the slider below (click here to see the same domain/enhancement as shown above at 0200 UTC) that overlays SAR winds on top of the GOES-18 Band 13 Clean Window infrared (10.3 µm) brightness temperatures. Peak winds per the SAR analysis increased from just under 50 m/s at 0200 to nearly 60 m/s at 1400 UTC. The SAR wind structure at 1402 UTC shows two wind maxima over the western half of the storm. That double structure is also suggested at the end of the MIMIC-TC animation (from this website) shown below.
Using the methods discussed in this blog post, and after I created a domain centered on Calvin, NOAA-21 and Suomi-NPP imagery (in a very low-light condition) Day Night Band visible (0.7 µm) imagery were created with Polar2Grid (in this case, Polar2Grid’s hncc enhancement looked best), and a toggle of the two images, 30 minutes apart, is below. No lightning is detected in these images. The toggle of JPSS Day Night band imagery again testifies to the value of multiple JPSS satellites in orbit!
NOAA-21 (0905 UTC, 14 July) and Suomi NPP (0929 UTC, 14 July) Day Night Band visible (0.7 µm) imagery (Click to enlarge)
A GOES-3 visible loop from July 14, 1980. Displayed with McIDAS-X software. [Click image to play animation]
The CIMSS mission includes three goals:
Foster collaborative research among NOAA, NASA, and the University in those aspects of atmospheric and earth system sciences that exploit the use of satellite technology;
Serve as a center at which scientists and engineers working on problems of mutual interest can focus on satellite-related research in atmospheric and earth system science;
Stimulate the training of scientists and engineers in the disciplines involved in atmospheric and earth science.
A visible loop from July 14, 1980 from NASA’s SMS geostationary satellite. [Click image to play animation]An infrared loop from July 14, 1980 from NASA’s SMS geostationary satellite. [Click image to play animation]A visible full disk image from July 14, 1980 at 1730 UTC from NASA’s SMS geostationary satellite.
The above image pair compare a NASA SMS from 1980 to an GOES-16ABI true color composite from 2020. Both images are from July 14th. The GOES-16 data was generated using Geo2Grid software.
The NOAA Open Data Dissemination (NODD) resource (more information at this link) provides global data from JPSS. One source from which data are available is Amazon Web Services, with separate portals for Suomi NPP, for NOAA-20 and for NOAA-21. The data at those sites are arranged by times; step one for data... Read More
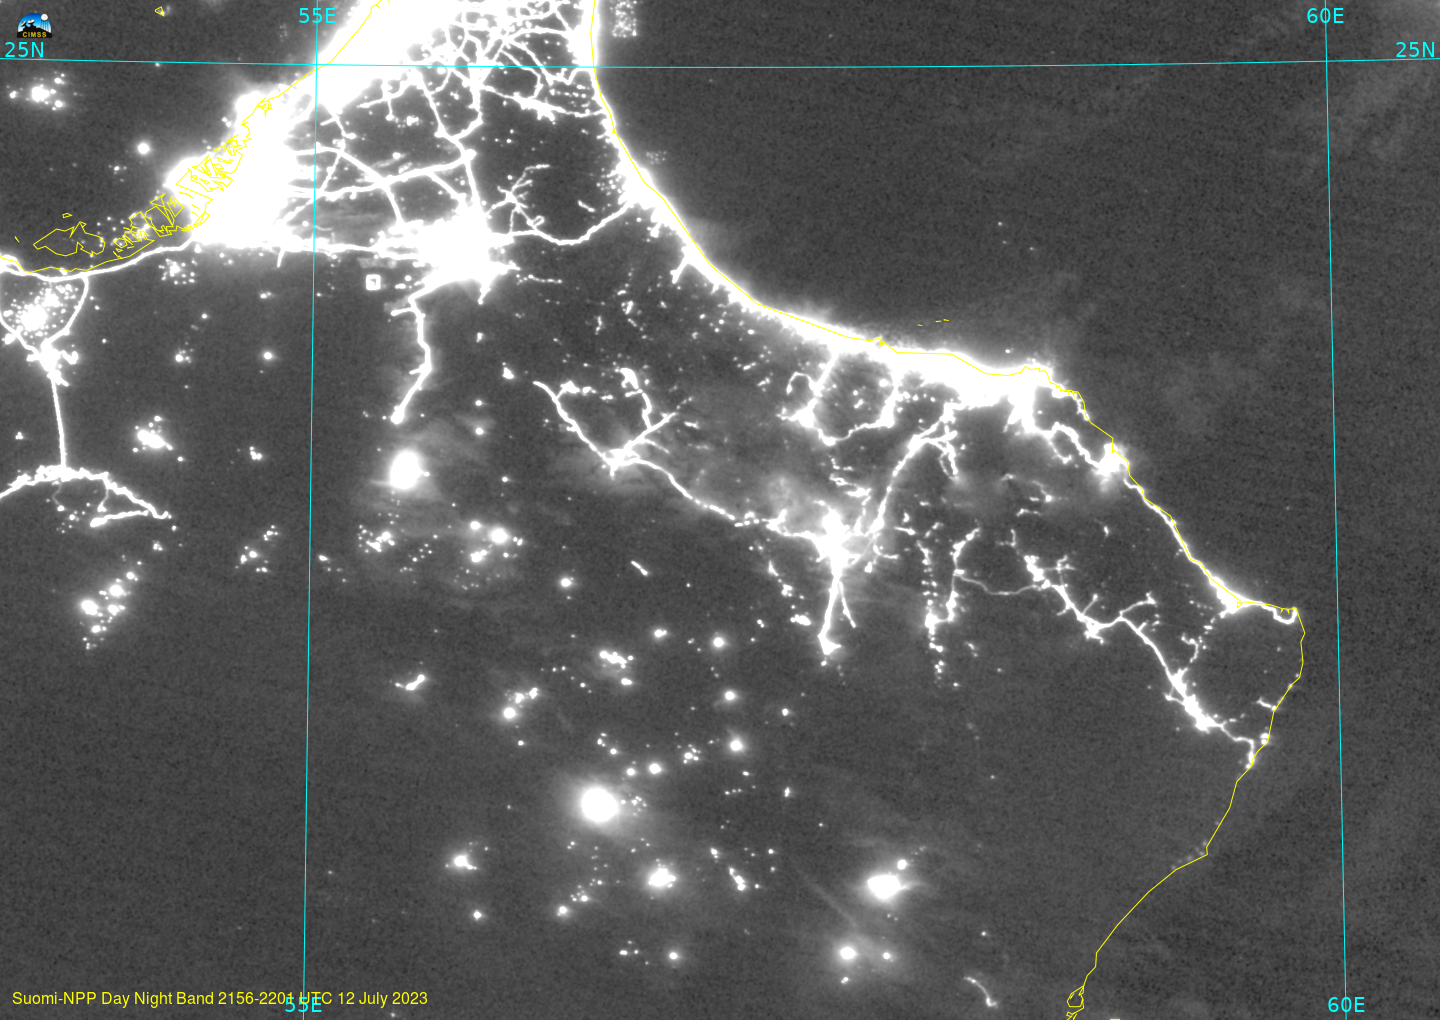
Suomi NPP VIIRS Day NIght Band imagery, 2156-2201 UTC on 12 July 2023 (Click to enlarge)
The NOAA Open Data Dissemination (NODD) resource (more information at this link) provides global data from JPSS. One source from which data are available is Amazon Web Services, with separate portals for Suomi NPP, for NOAA-20 and for NOAA-21. The data at those sites are arranged by times; step one for data acquisition/imagery creation will be: how do I find the time of the data that I want? Time-stamped polar orbit tracks for many satellites are available at the SSEC Polar Orbit Tracker. For this exercise, I’ve decided to plot imagery over Oman, using data from Suomi-NPP, from 11 July and 12 July 2023. These two orbital path plots are also shown below, side-by-side. Based on these plots, data 2215 to 2220 UTC on 11 July, and from 2156 to 2201 UTC on 12 July, are needed. As expected, the orbit on 12 July is a bit earlier, and a bit farther east, than the orbit on 11 July.
Predicted Suomi-NPP overpasses, 11 July (left) and 12 July (right) 2023 (Click to enlarge)
The front page of the Amazon Web Services data portal (url) is shown below. Various data sources are indicated, and the ones relevant for Day Night Band imagery, the Sensor Data Record (SDR) and the geolocation data, are highlighted. Clicking on those two links will lead you down through dates: first, the year (2023), then the month (07), then the days (11 and 12) of the month.
AWS Front Page for Suomi NPP data. Needed directories for DNB data and DNB Geolocation files are highlighted (Click to enlarge)
At the AWS website, the files highlighted below can be found within the VIIRS-DNB-SDR file structure highlighted above. The 4 files cover the time from 2156 UTC through 2201 UTC on 12 July. Four files covering the same time must also be retrieved from the VIIRS-DNB-GEO directories (so that Polar2Grid can georeference the imagery).
Listing of Day Night band files including those to be displayed (highlighted; click to enlarge).
The 8 files, 4 SDR files, and 4 Geolocation files, were downloaded into a single directory ($POLAR2GRID_HOME/bin/Oman/12July/) and are shown below. Data for the first granule starts at 21:56:05.6 ; data for the last granule ends at 22:01:46.0. Compare these times to the predicted orbit path for 12 July.
What kind of products will Polar2Grid create given these input fields? The –list-products-all flag shows that, that is: $POLAR2GRID_HOME/bin/polar2grid.sh -r viirs_sdr -w geotiff --list-products-all -f $POLAR2GRID_HOME/bin/Oman/12July/*.h5, which yields the list below.
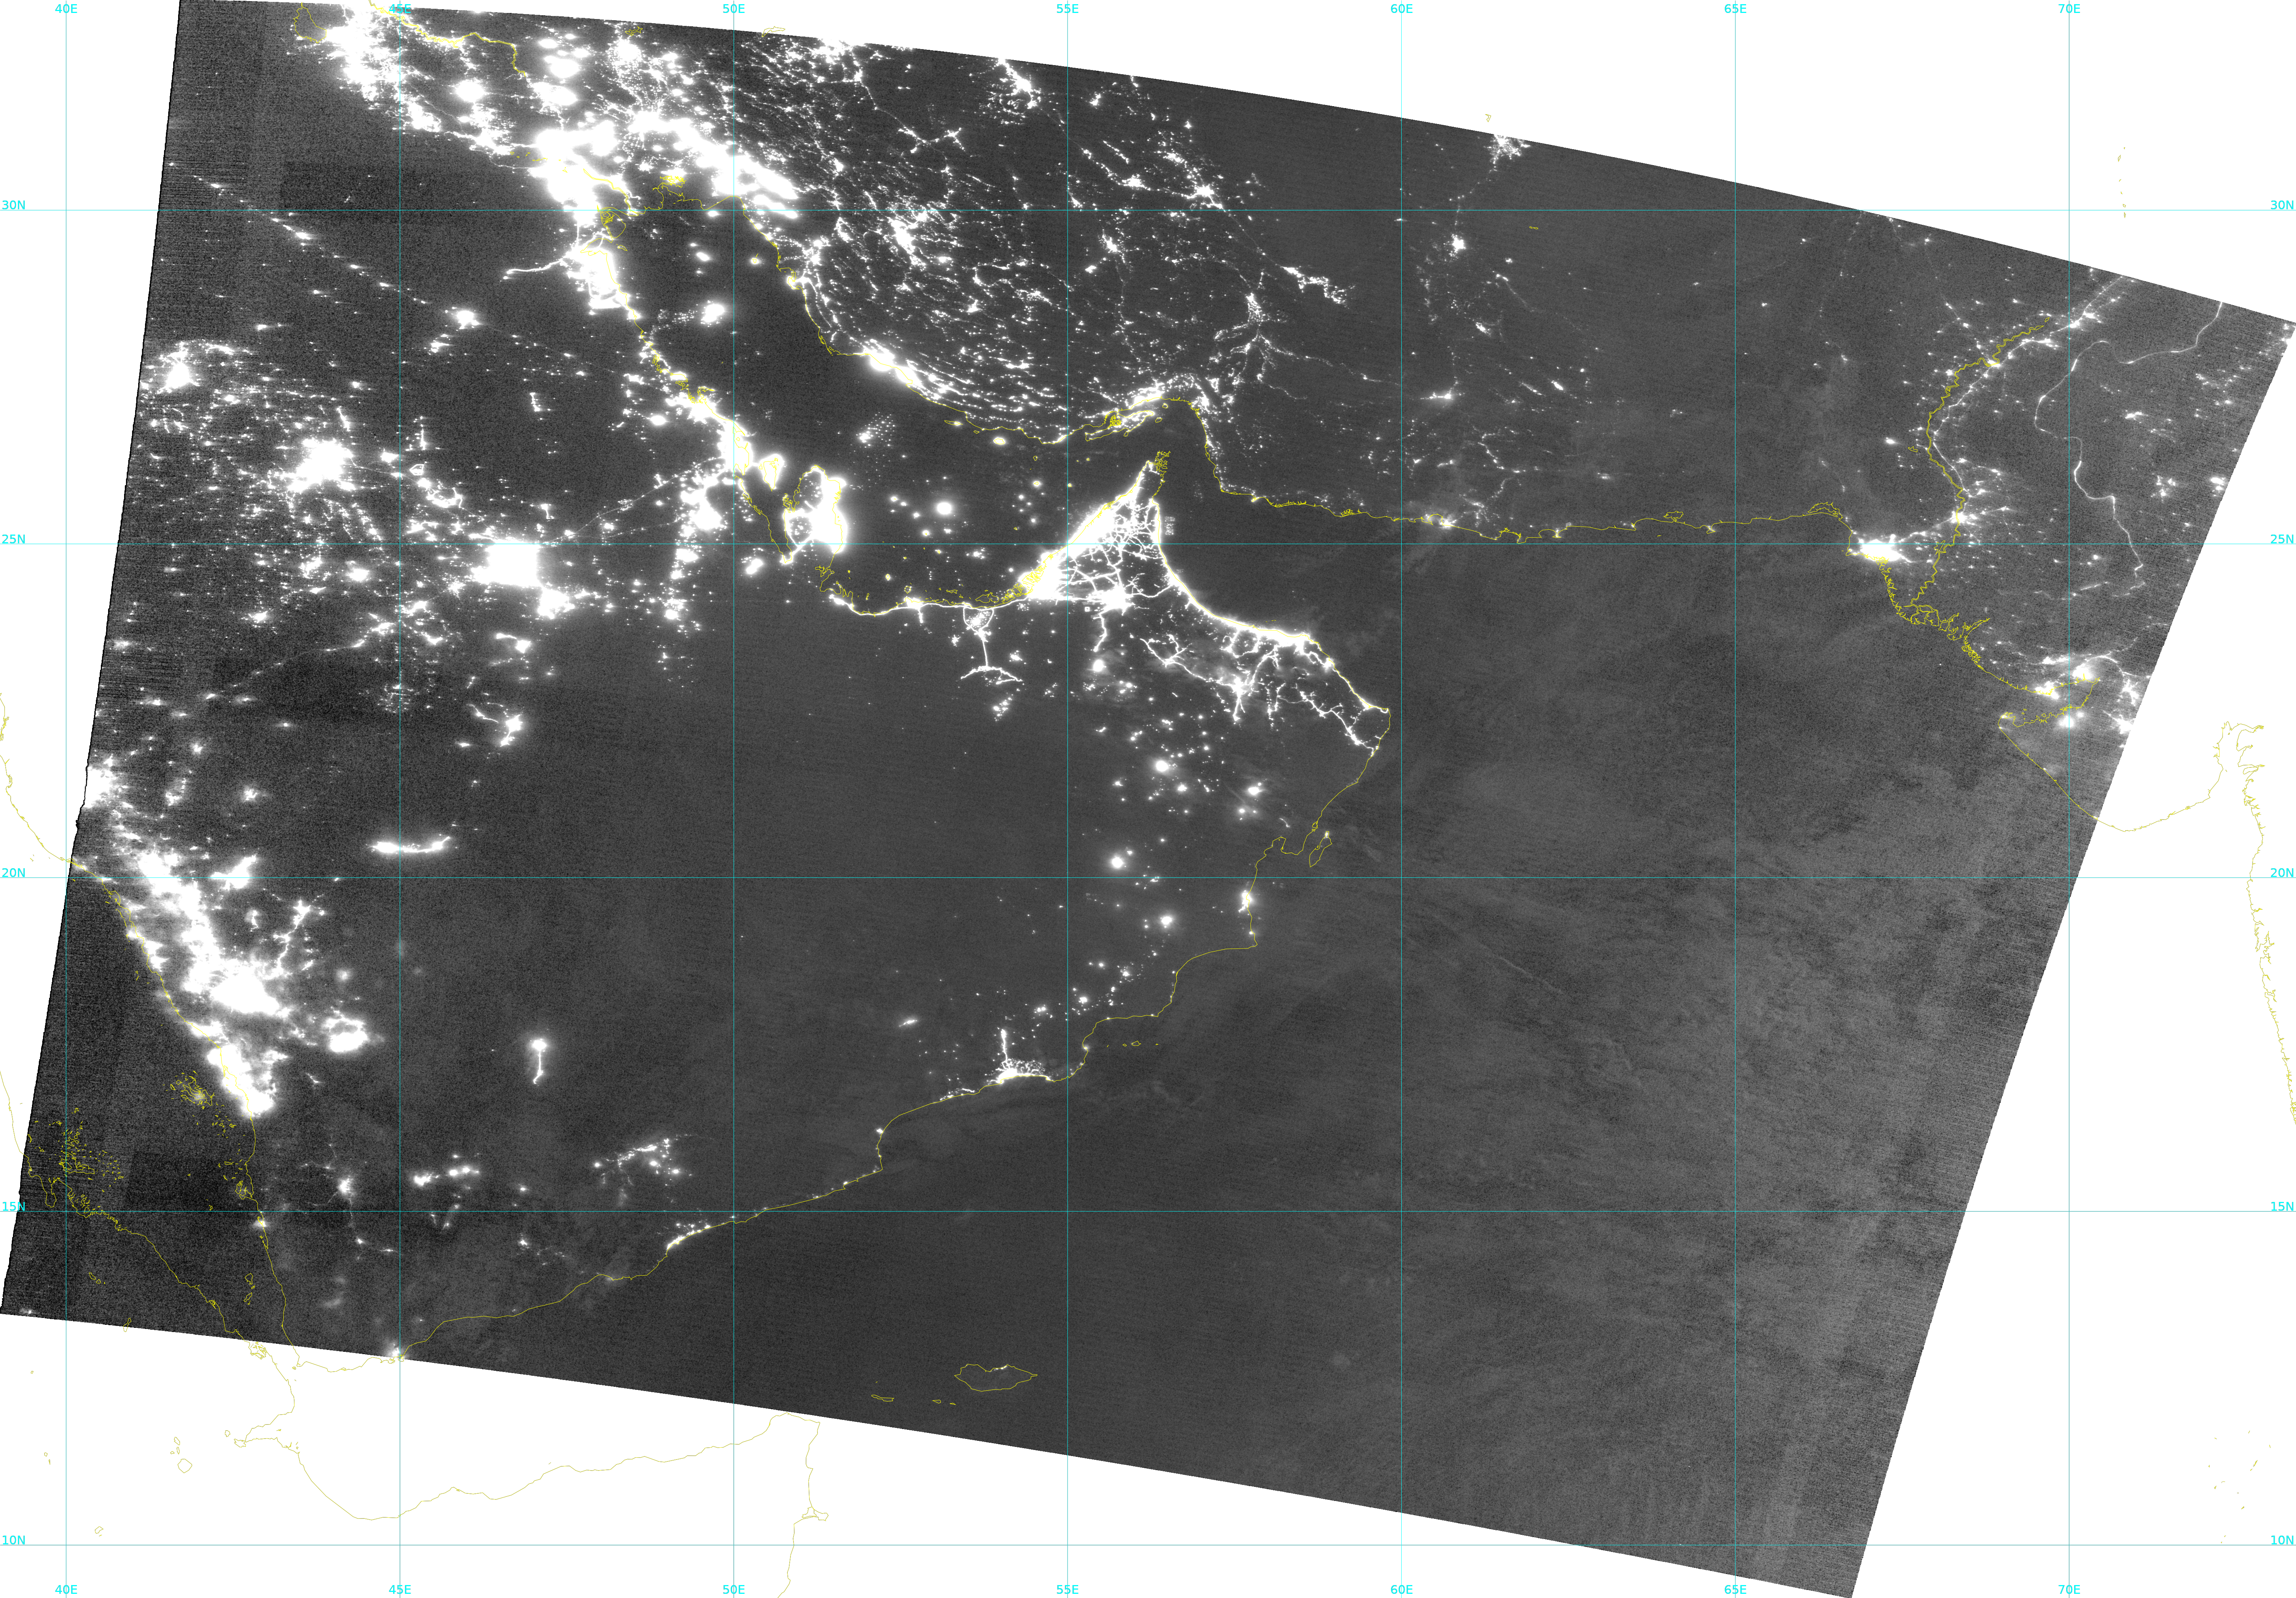
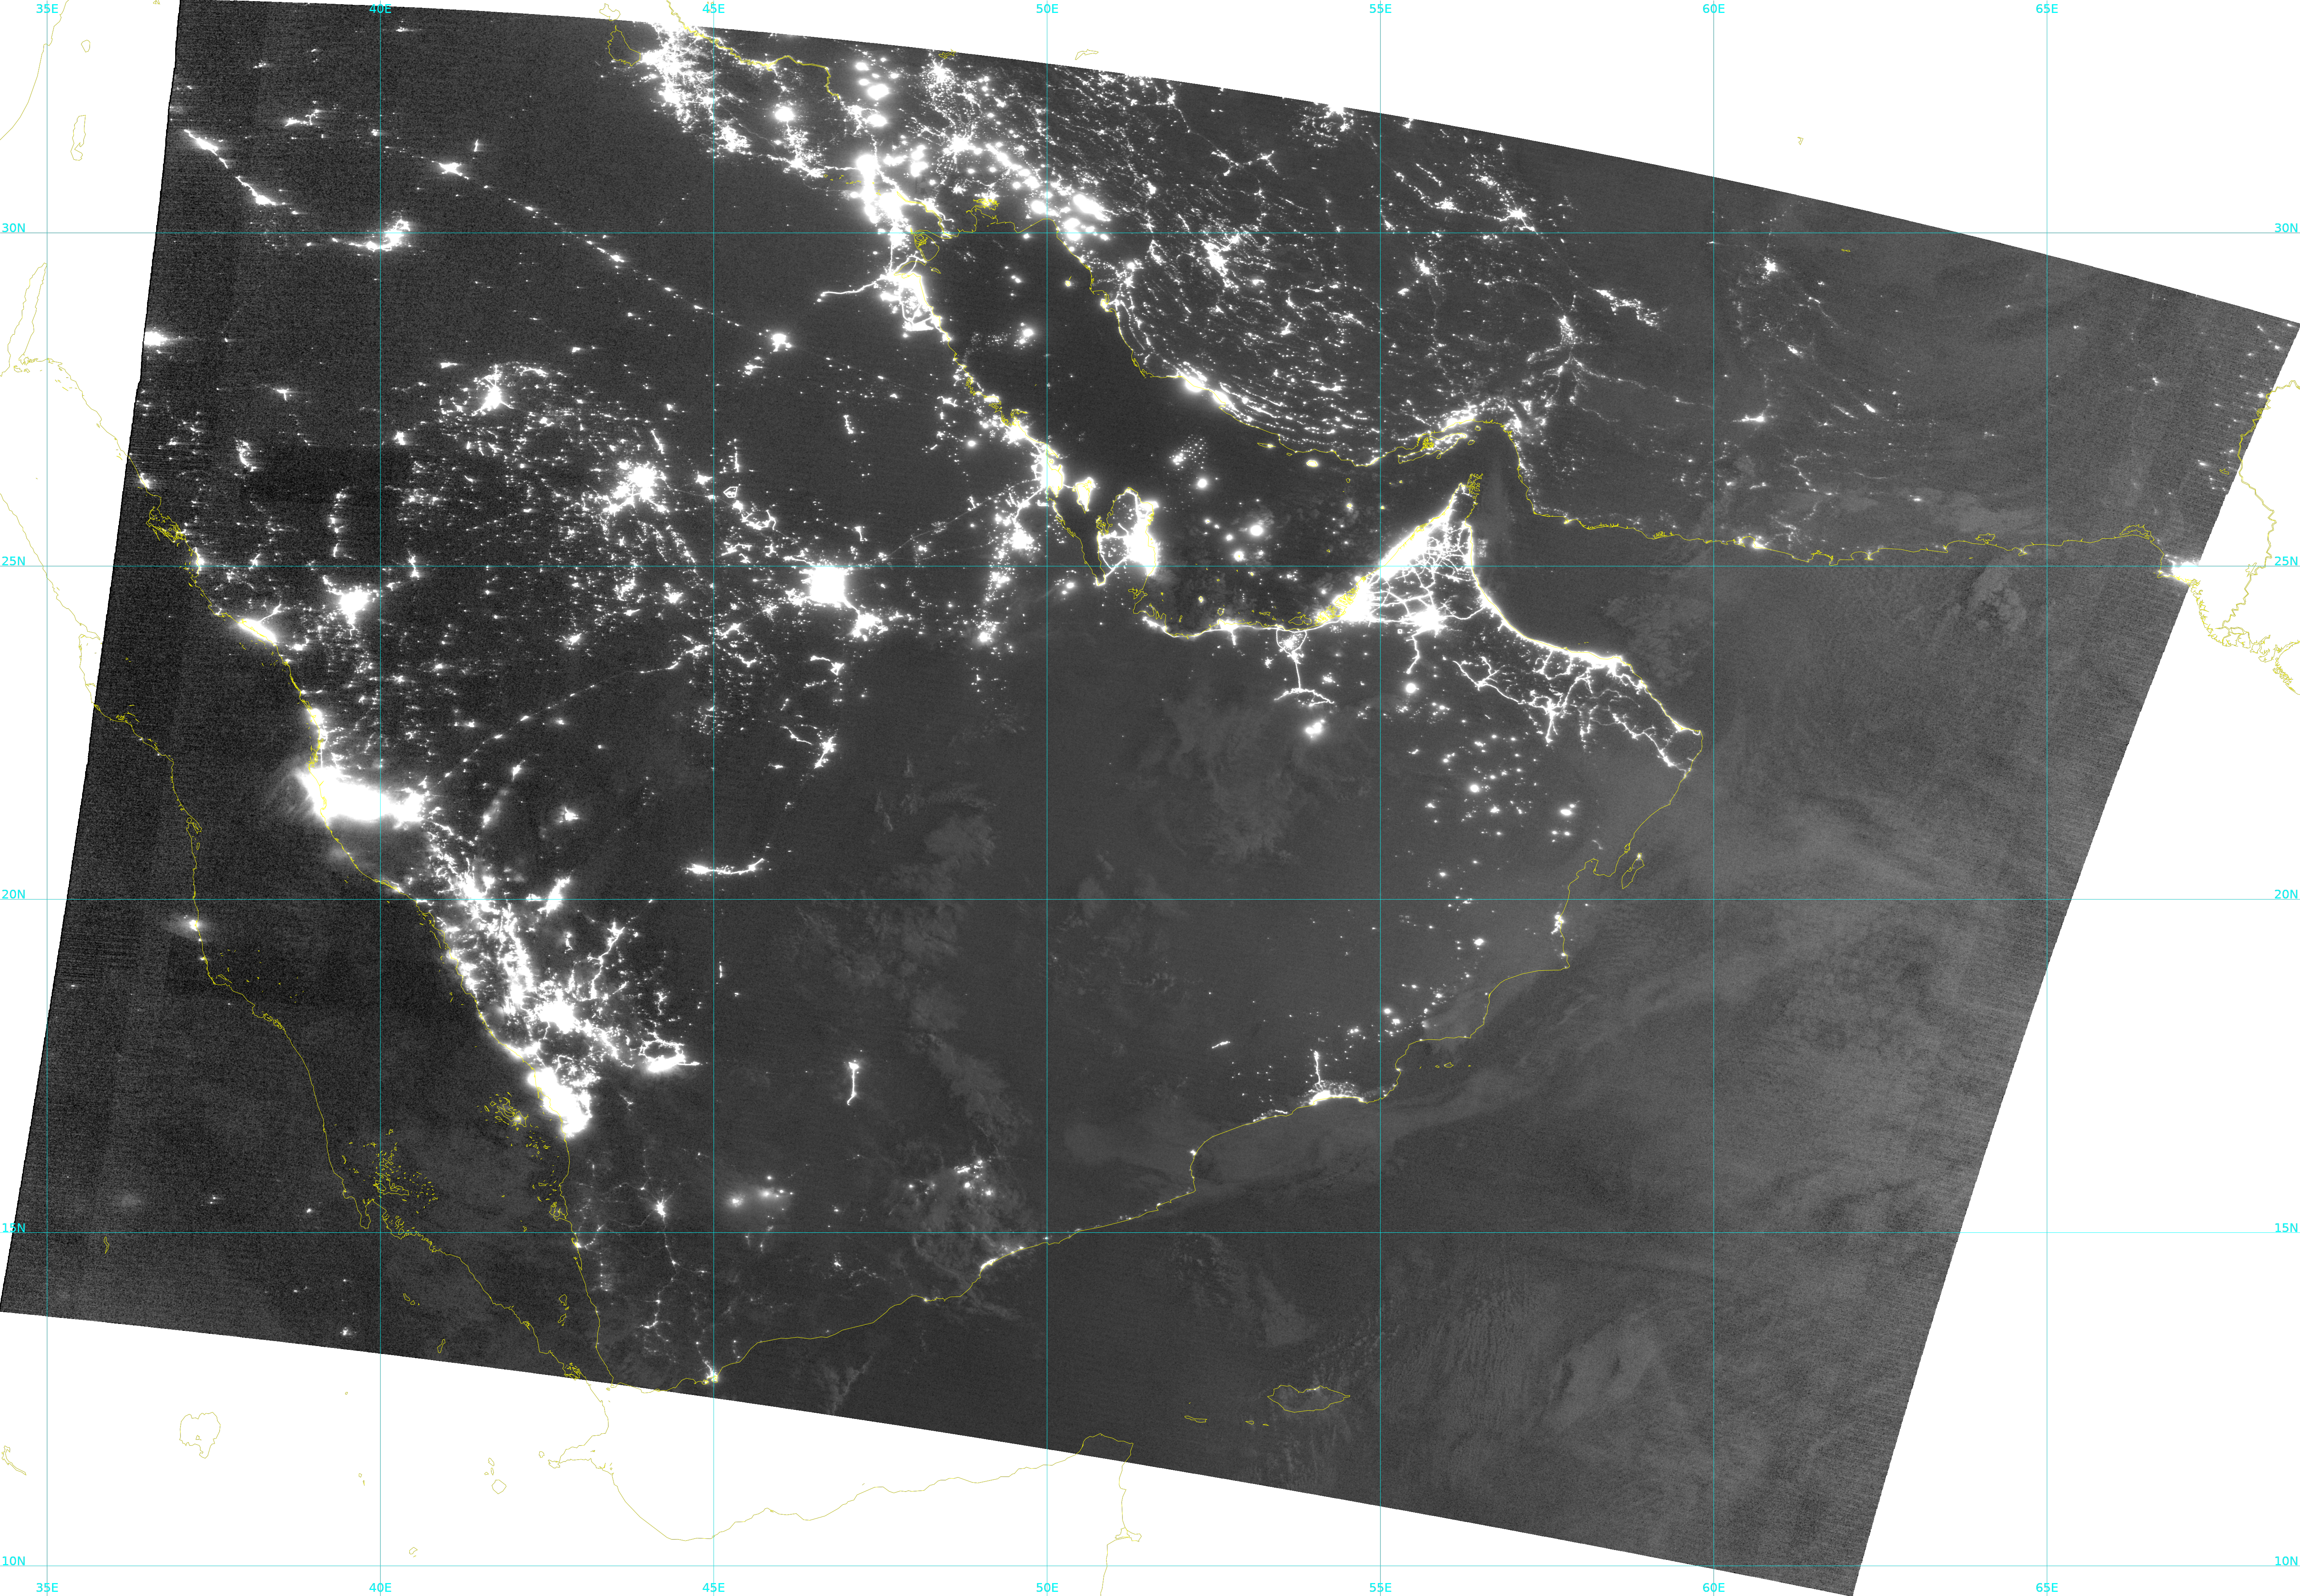
Several different types of Day Night Band products are available; I chose dynamic_dnb because it looked best for this day, and command used was $POLAR2GRID_HOME/bin/polar2grid.sh -r viirs_sdr -w geotiff -p dynamic_dnb -f $POLAR2GRID_HOME/bin/Oman/12July/*.h5; that yields a geotiff file; $POLAR2GRID_HOME/bin/add_coastlines.sh --add-coastlines --add-grid --grid-D 5.0 5.0 --grid-d 5.0 5.0 npp_viirs_dynamic_dnb_20230712_215731_wgs84_fit.tif adds georeferencing — coastlines and latitude/longitude lines, and writes out a png file that is shown at the top of this blog post. A similar set of commands produced the image from 11 July 2023 over about the same region, shown below.
Suomi-NPP Day Night Band visible imagery, 2215-2220 UTC on 11 July 2023 (Click to enlarge)
What if you want to see how things change in a region from one image to the next? That is complicated if you look at the native projections as shown above. However, Polar2Grid allows you to re-grid data onto a pre-defined grid that you can easily create with the a built-in script: $POLAR2GRID_HOME/bin/p2g_grid_helper.sh Oman 57.0 23.0 500.0 -500.0 1440 1020 > $POLAR2GRID_HOME/bin/Oman/Oman.yaml ; this command defines the ‘Oman’ grid, centered at 57oE, 23oN, with grid-spacing of 500 m in the west-east and north-south directions. The grid size is 1440×1020. The Polar2Grid calls to make the output, and to add coastlines and latitute/longitude grids are shown below. These scripts all sit within the $POLAR2GRID_HOME/bin directory.
I annotated the png files created by the two add_coastlines.sh invocations above, and the result is shown below in a toggle. The moon on these two days was not providing illumination, but clouds can still be viewed over the bright lights of Oman and the United Arab Emirates.
Day Night Band imagery over Oman, 11 and 12 July 2023 (Click to enlarge)


