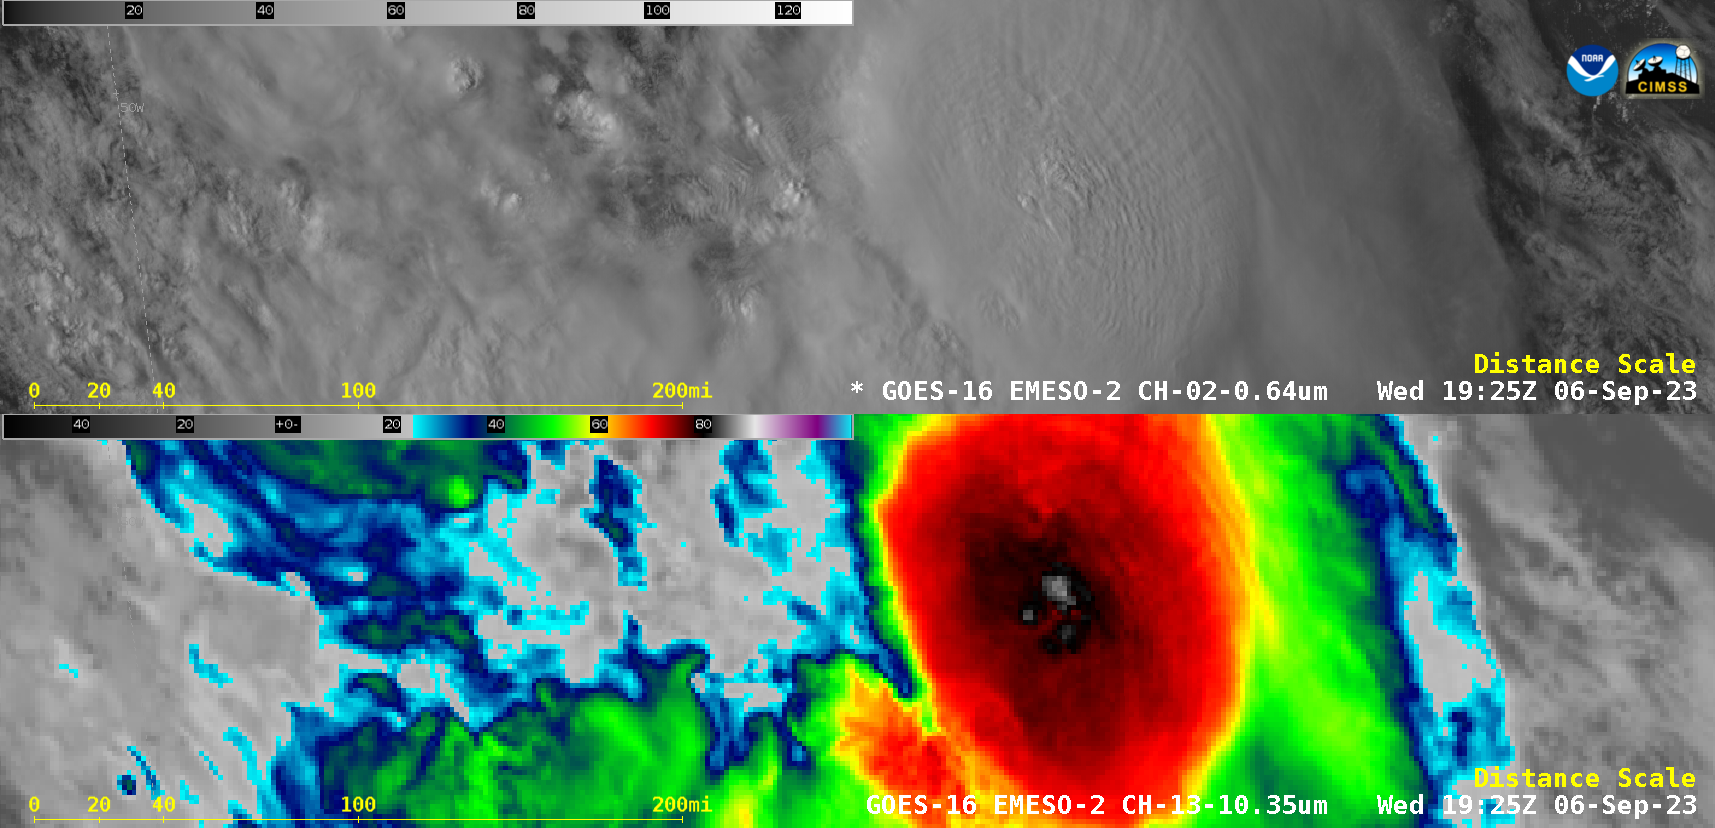

GOES-16 “Red” Visible (0.64 µm, top) and “Clean” Infrared Window (10.3 µm, bottom) images, from 1700-2100 UTC [click to play animated GIF | MP4]
1-minute Mesoscale Domain Sector GOES-16 (GOES-East) “Red” Visible (0.64 µm) and “Clean” Infrared Window (10.3 µm) images (above) showed Lee as it intensified to become a Category 1 Hurricane in the Central Atlantic Ocean on 06 September 2023. The coldest cloud-top infrared brightness temperatures were around -90C (brighter white pixels embedded within darker black areas).
Lee had been moving across warm water — and was traversing an environment having low deep-layer wind shear (below) — factors which were favorable for intensification. Water temperature and wind shear imagery was sourced from the CIMSS Tropical Cyclones site.
GOES-16 Infrared Window images, with contours and streamlines of deep-layer wind shear at 2100 UTC [click to enlarge]
Meanwhile, in the East Pacific Hurricane Jova rapidly intensified to a Category 4 storm by 2100 UTC on 06 September, exhibiting a pinhole eye as seen in GOES-18 (GOES-West) Visible and Infrared imagery (below).

GOES-18 “Red” Visible (0.64 µm, top) and “Clean” Infrared Window (10.3 µm, bottom) images, from 1800-0000 UTC [click to play animated GIF | MP4]
Similar to Lee, Jova had been moving across warm water — and was traversing an environment having low deep-layer wind shear (below) — factors which were favorable for intensification.
GOES-18 Infrared Window images, with contours and streamlines of deep-layer wind shear at 2200 UTC [click to enlarge]
Jova was later upgraded to Category 5 intensity at 0900 UTC (Infrared images: animated GIF | MP4).
===== 07 September Update =====

GOES-16 Infrared images, from 2100 UTC on 07 September to 0300 UTC on 08 September [click to play animated GIF | MP4]
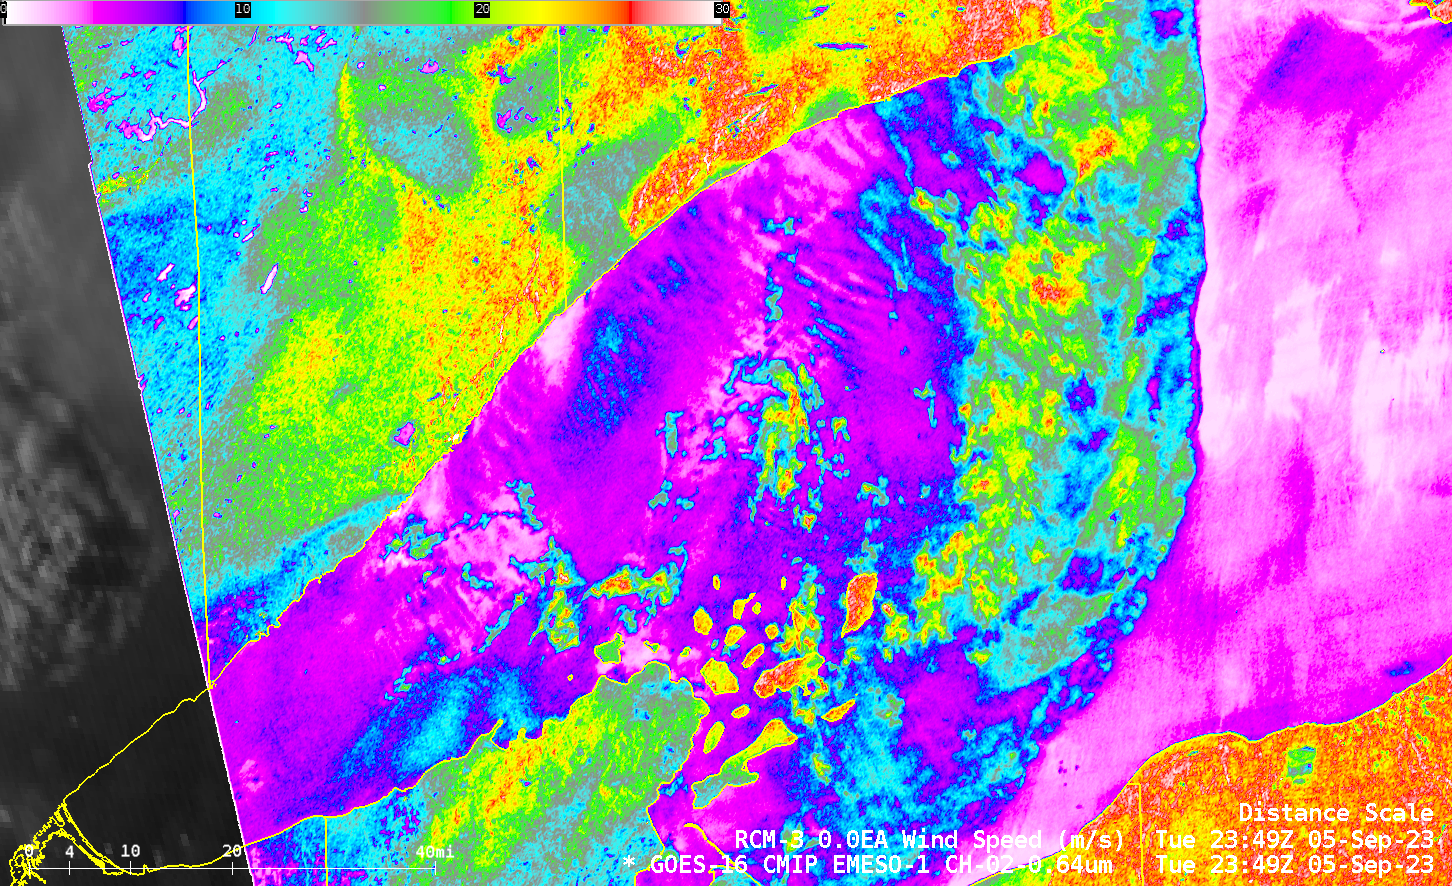
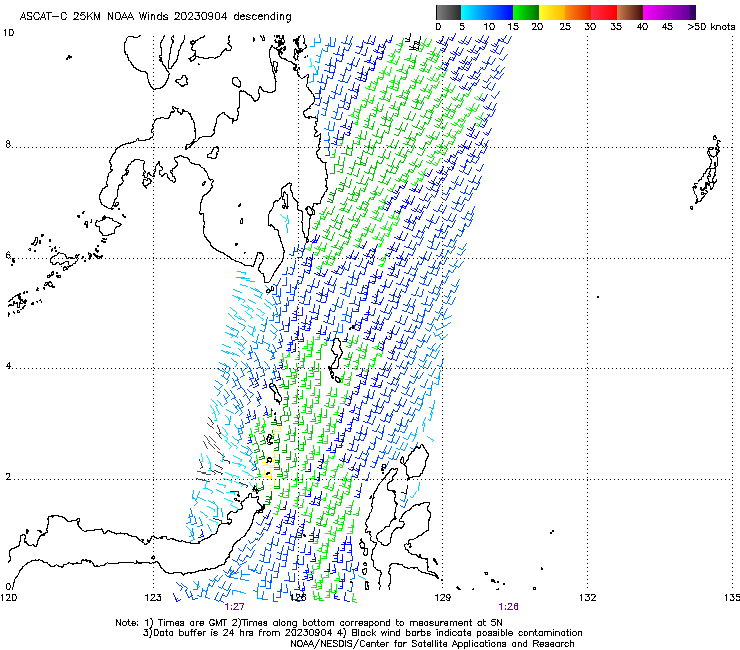
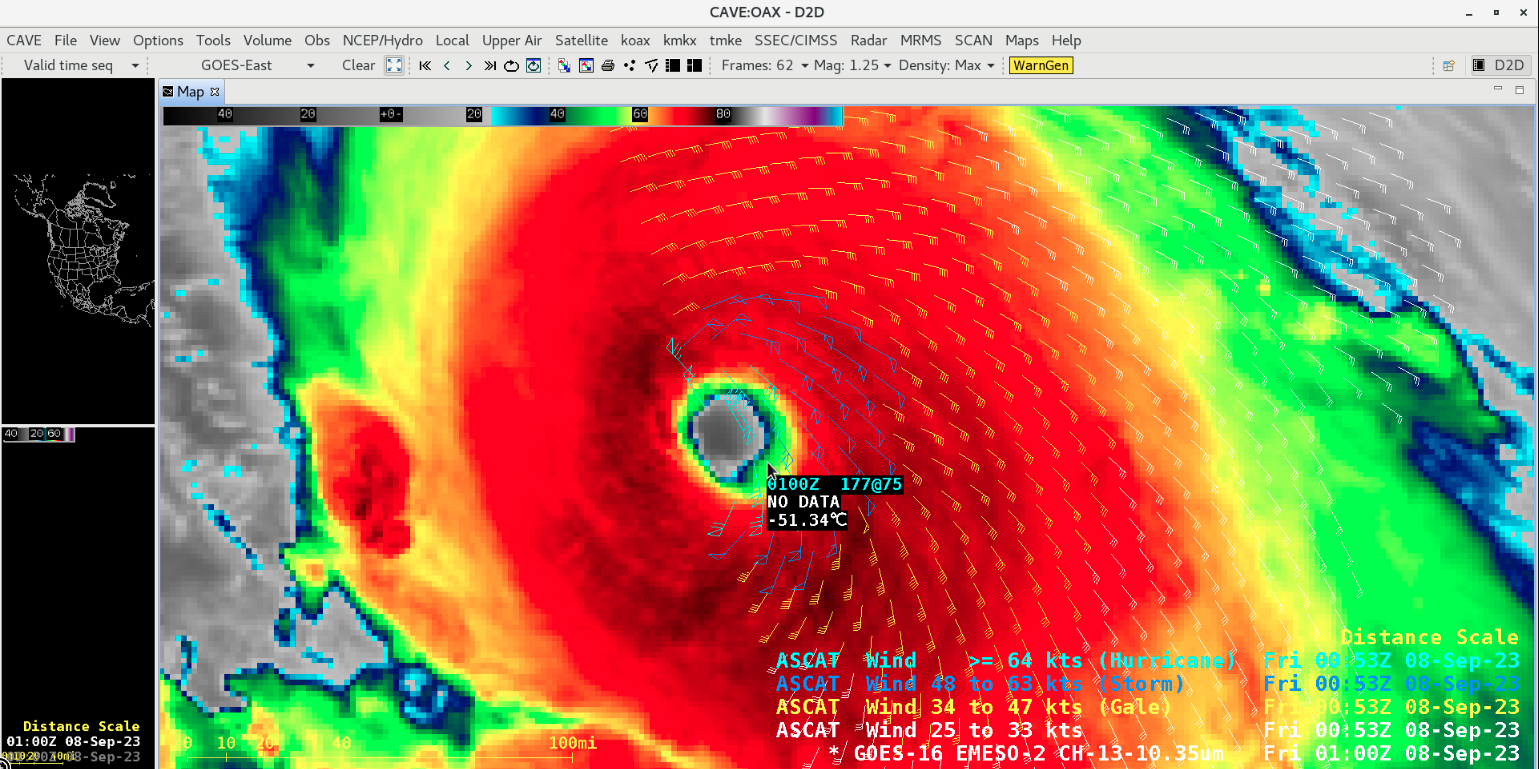
At 0300 UTC on 08 September, Hurricane Lee was upgraded to a Category 5 storm (the first Category 5 of the 2023 Atlantic Basin season). 6 hours of 1-minute GOES-16 Infrared images leading up to that time are shown above — and the 0100 UTC Infrared image with an overlay of Metop-C ASCAT surface scatterometer winds is shown below. Note: 25-km resolution ASCAT winds are available in AWIPS, which indicated a maximum speed of 75 knots — however, the Ultra-High Resolution (UHR) ASCAT wind product at that time (source) had a maximum speed of 136 knots.
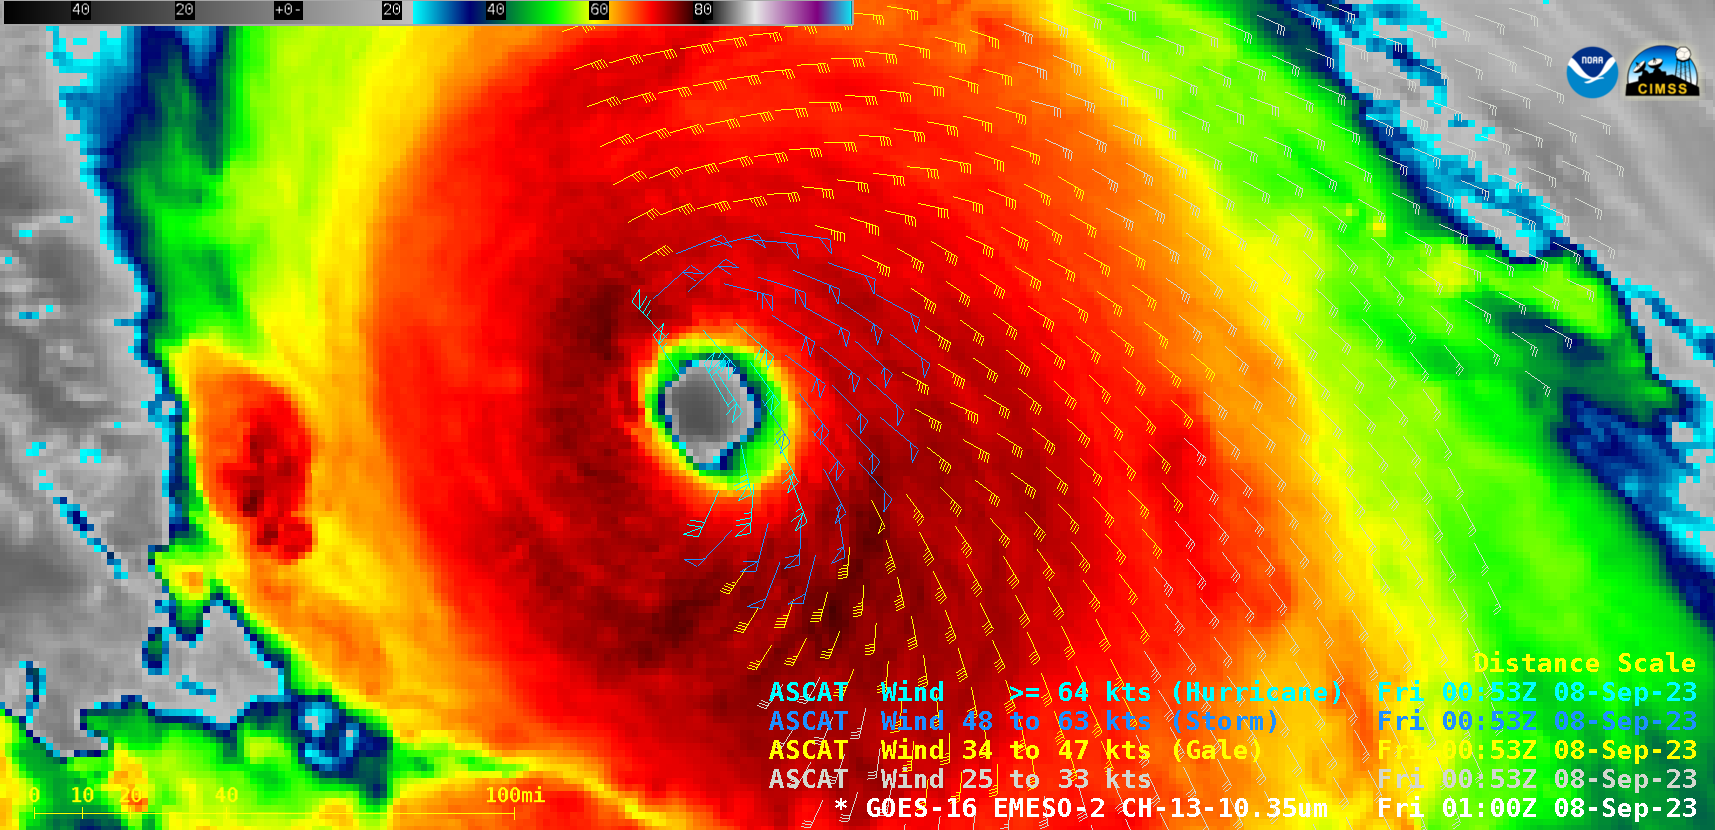
GOES-16 Infrared Window image, with an overlay of Metop-C ASCAT surface scatterometer winds [click to enlarge]
Even though deep-layer wind shear was gradually increasing in its vicinity, Lee reached Category 5 intensity as it began to move across water with increasing values of Ocean Heat Content and Sea Surface Temperature (below).
Ocean Heat Content and Sea Surface Temperature on 07 September, with an overlay of the track of Hurricane Lee [click to enlarge]
View only this post Read Less
