This website works best with a newer web browser such as Chrome, Firefox, Safari or Microsoft
Edge. Internet Explorer is not supported by this website.
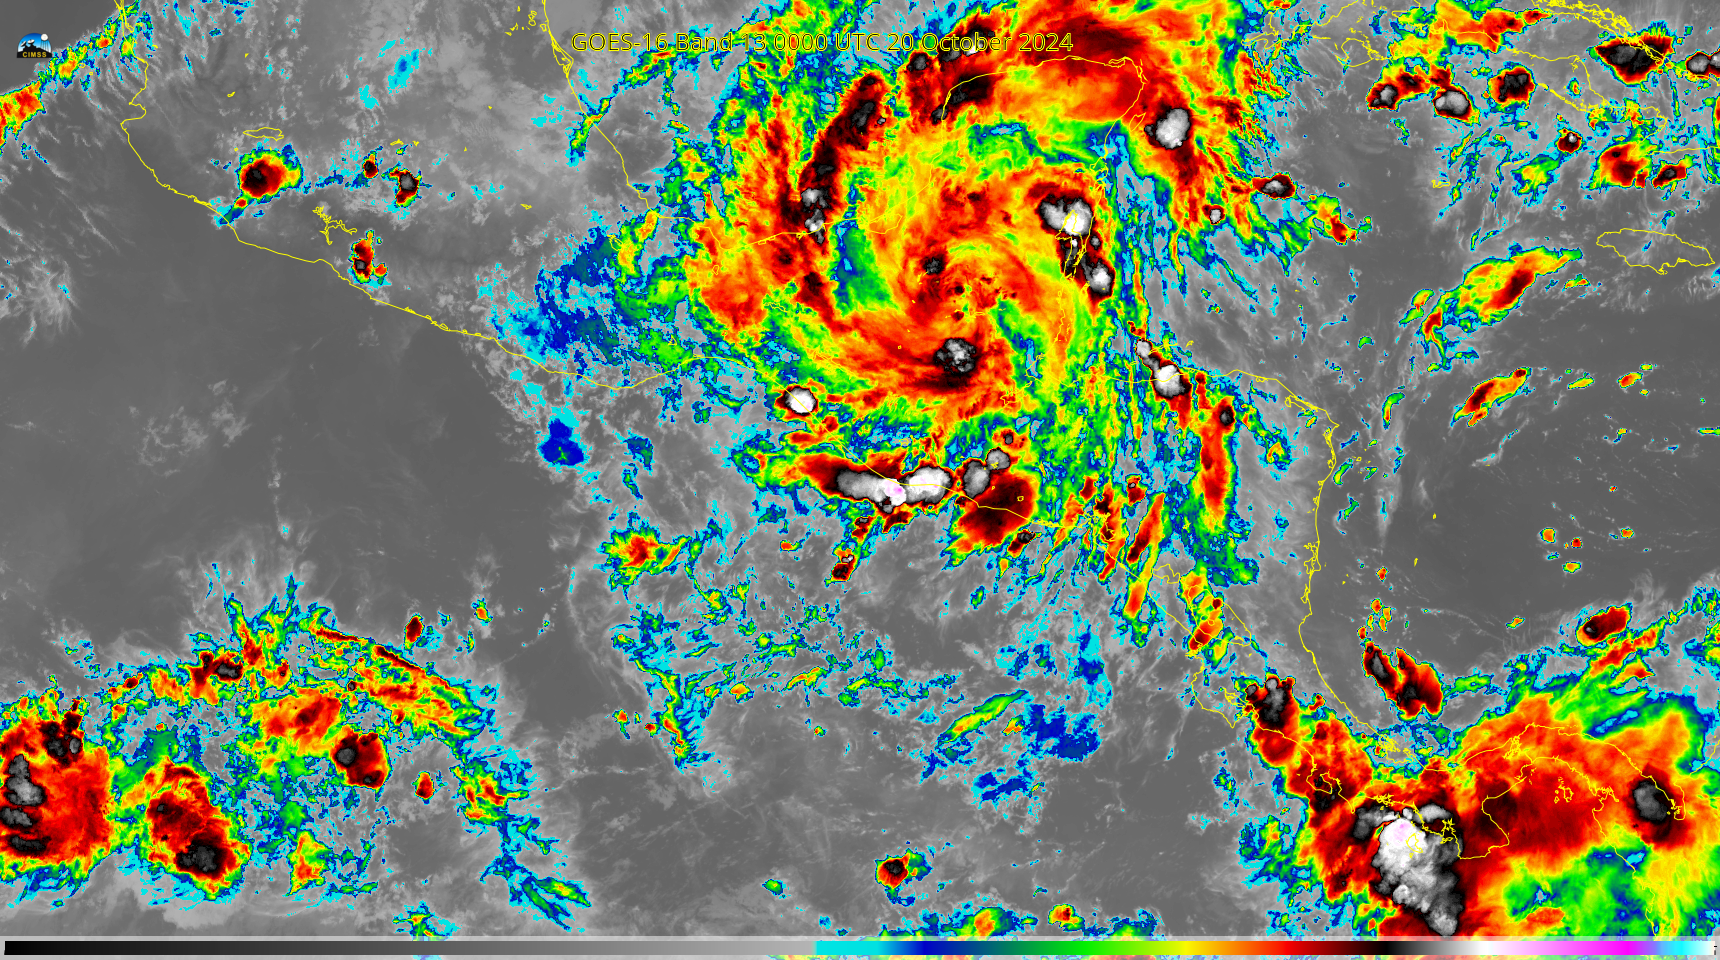
Tropical Storm Nadine made landfall in Belize on 19 October (at 1600 UTC), and parts of this system then crossed Central America and entered the Pacific Ocean (Here is the NHC discussion that mentions this — from 1500 UTC on 20 October). Tropical Storm Kristy formed off the coast of Mexico later in the day on the... Read More
Tropical Storm Nadine made landfall in Belize on 19 October (at 1600 UTC), and parts of this system then crossed Central America and entered the Pacific Ocean (Here is the NHC discussion that mentions this — from 1500 UTC on 20 October). Tropical Storm Kristy formed off the coast of Mexico later in the day on the 21st of October. The GOES-16 animation of clean window infrared imagery, below, shows the cloud features associated with both systems. Nadine maintained a detectable cyclonic rotation through about 1200 UTC on 20 October. Subsequent to that time, the clouds associated with Nadine moved into central Mexico as a large convective complex developed over the Pacific Ocean to the south of Mexico — this is the system that became Kristy.
GOES-16 Clean Window infrared imagery (Band 13, 10.3 µm), 1800 UTC 18 October – 0600 UTC 22 October 2024 (Click to enlarge)
It does happen occasionally that tropical systems in the Atlantic traverse Central America and become tropical systems in the Pacific. Although these two systems, Nadine and Kristy, shared the same airmass, they are not the same system.
Scatterometry data (from the manati site) from OSCAT (below) and from ASCAT (at bottom), show the evolution from strong northerly winds over the Gulf of Tehuantepec that quickly coalesce into a strong tropical circulation.
OSCAT-3 winds on 20 October (0559 and 1817 UTC) and 21 October (0652 and 1910 UTC) (Click to enlarge)ASCAT winds from Metop-B and Metop-C on 20 October 2024 (1519 and 1614 UTC) and from 21 October 2024 (0322, 0407, 1534, 1638 UTC) (Click to enlarge)
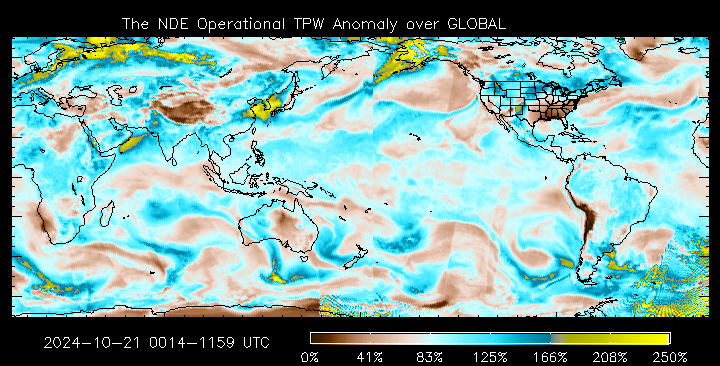
MIMIC Total Precipitable Water fields for the 24 hours ending 1800 UTC on 21 October 2024, above, show a stream of rich moisture pulled northward into Alaska ahead of a strong storm over western Russia. The result was large snowfall rates over much of central and northern Alaska, as shown... Read More
MIMIC Total Precipitable Water, 1900 UTC on 20 October through 1800 UTC on 21 October 2024 (Click to enlarge)
MIMIC Total Precipitable Water fields for the 24 hours ending 1800 UTC on 21 October 2024, above, show a stream of rich moisture pulled northward into Alaska ahead of a strong storm over western Russia. The result was large snowfall rates over much of central and northern Alaska, as shown in the snowfall rate from this website (here is a Quick Guide on MIRS Snowfall rate) animation below. Two principle bands of snow are indicated, one over eastern Alaska, oriented south-southeast to north-northwest, and one over north-central Alaska, oriented by southeast to northwest.
Snowfall rates from Microwave observations, 0417 – 1512 UTC on 21 October 2024 (click to enlarge)
There are NOAA-20 and NOAA-21 overpasses in the animation above, and data (infrared and microwave) from those satellites can be used to create vertical profiles of temperature, that is, NUCAPS profiles. Those profiles can be gridded to show swaths of thermodynamic variables, such as the 850-mb temperature field shown below. The colorbar has been edited in AWIPS so that values near 0oC (i.e., the melting point), are black. However, many regions show temperatures at 850 mb colder than 0oC, but with rain observed at the surface! A possible reason in this discrepancy is that the data being used in the gridding in central AK is from soundings that did not converge, or from soundings that include only microwave data (that is, the infrared retrieval did not converge to a solution). See the image at the bottom, showing ‘Data Quality’; yellow shows profiles for which the infrared retrieval failed (but the microwave retrieval did not) red are regions where both infrared and microwave retrievals failed. It’s also possible that some of these points are below ground! There are many things to consider when interpreting NUCAPS temperature fields.
850-mb Temperatures from NOAA-20 NUCAPS profiles, 1230 UTC on 21 October 2024 (click to enlarge)NUCAPS Quality Flags, 1240 UTC on 21 October 2024 (Click to enlarge)
Just how unusually moist is this airmass over Alaska? Percent of Normal fields, from this site, show values in excess of 200% of normal!
Percent of Normal TPW Anomalies, 1200 UTC on 21 October 2024 (click to enlarge)
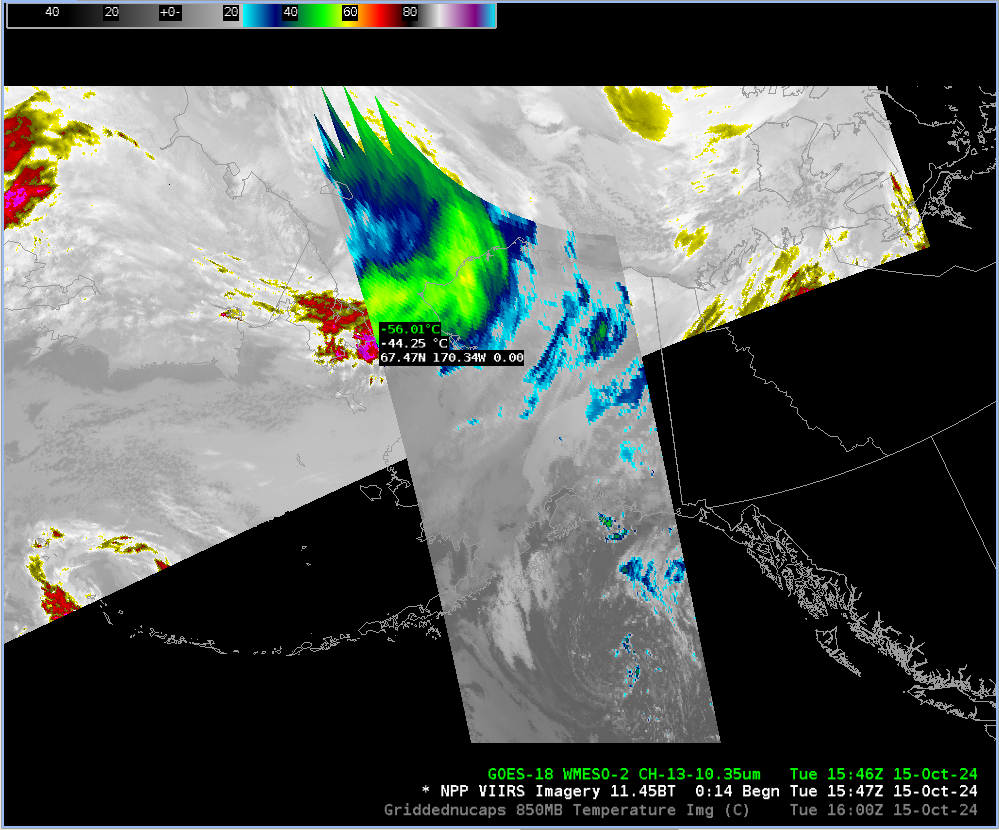
VIIRS infrared imagery (I05 imagery at 11.45 µm) from the NOAA-21 (mislabeled, alas, at Suomi NPP) show high-resolution infrared imagery at about 90-minute time-steps. Cold Cloud tops associated with a low pressure system bringing light snow to northern Alaska are apparent — but during the gap from 00-08 UTC on... Read More
NOAA-21 VIIRS I05 infrared (11.45 µm) data, 1547 UTC 15 October through 1209 UTC 16 October 2024 (Click to enlarge)
VIIRS infrared imagery (I05 imagery at 11.45 µm) from the NOAA-21 (mislabeled, alas, at Suomi NPP) show high-resolution infrared imagery at about 90-minute time-steps. Cold Cloud tops associated with a low pressure system bringing light snow to northern Alaska are apparent — but during the gap from 00-08 UTC on 16 October when NOAA-21 does view Alaska, the satellite signature of the system degrades significantly. GOES-18 ABI data is consistently viewing Alaska (and, indeed, Mesoscale Domain #2 from GOES-18 by default gives 1-minute imagery over Alaska), and those scenes time-matched to the VIIRS imagery above (shown below; one could show an animation with much finer time resolution with ABI to show exactly when the organization of the system changed most profoundly.) also show the change in organization to the system over Alaska. This animation (from this website) shows a surface analysis at 12-h time steps on the 15th and 16th.
GOES-18 Band 13 infrared (10.3 µm) data, 1547 UTC 15 October through 1209 UTC 16 October 2024 (Click to enlarge)
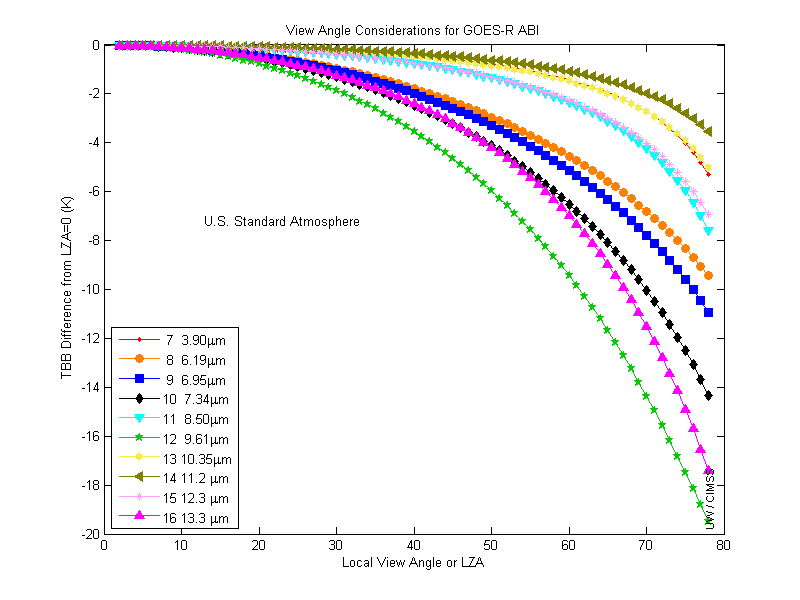
The two animations above have different scaling and different enhancements, although they have the same endpoints. The ABI imagery is uniformly colder, however, even though the resolution is much finer for VIIRS data. One reason for the difference is limb-cooling effects. The plot below shows how ABI Brightness Temperatures vary as a function of view angle. A very slanted view of the surface, or of a cloud, means a path from the near-surface to the satellite that passes through a lot of the cold upper tropopshere, leading to brightness temperatures.
Sampled Brightness Temperatures at 1547 UTC on 15 OCtober 2024 (Click to enlarge)Estimated difference between computed brightness temperatures at the sub-satellite point and at progressively larger view angle in a USA Standard Atmosphere (click to enlarge)
NOAA-20, NOAA-21 and Metop-C satellites all carry infrared and microwave sounders; data from those instruments can be used to create vertical profiles (NUCAPS Profiles) of temperature and humidity, and those profiles can be gridded to provide horizontal swaths of thermodynamic variables (i.e., ‘Gridded NUCAP’ fields). The animation shows estimates of 850-mb temperatures in swaths over/near Alaska between 1600 UTC on 15 October 2024 and 1400 UTC 16 October 2024. Temperatures colder than -15oC are widespread over northern Alaska and the Arctic Ocean.
850-mb Temperatures as esimated from NUCAPS Profiles, 1600 UTC 15 October – 1400 UTC 16 October 2024 (Click to enlarge)
Gridded NUCAPS fields are available outside of AWIPS at this site, and also here.
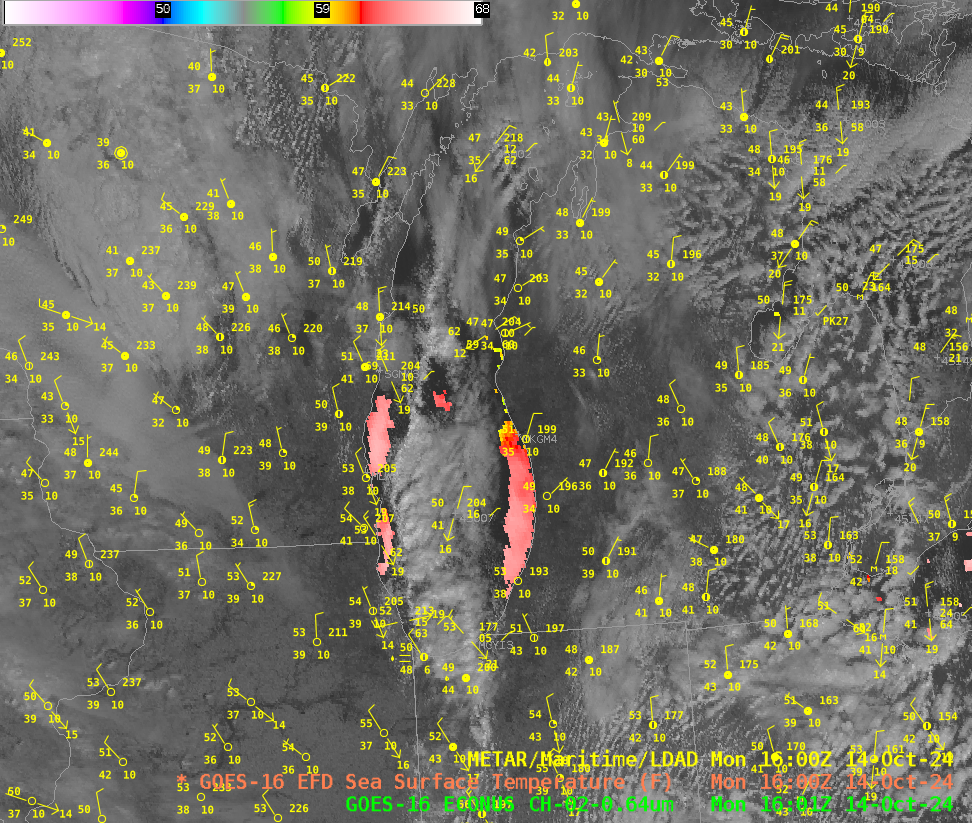
CSPP Geosphere imagery, above (link), shows a band of cumulus clouds over central Lake Michigan. The still image, below, from 1600 UTC shows cool air and surface winds converging into this band. The toggle from 1201 UTC, below, shows the band in the Night Microphysics RGB with NEXRAD reflectivity overlain,... Read More
GOES-16 Visible (band 2, 0.64 µm) imagery, 1251 – 1511 UTC on 14 October 2024
CSPP Geosphere imagery, above (link), shows a band of cumulus clouds over central Lake Michigan. The still image, below, from 1600 UTC shows cool air and surface winds converging into this band.
GOES-16 Visible Imagery (Band 2, 0.64 µm), and Level 2 Lake Surface Temperatures (all values exceed 15 C) (Click to enlarge)
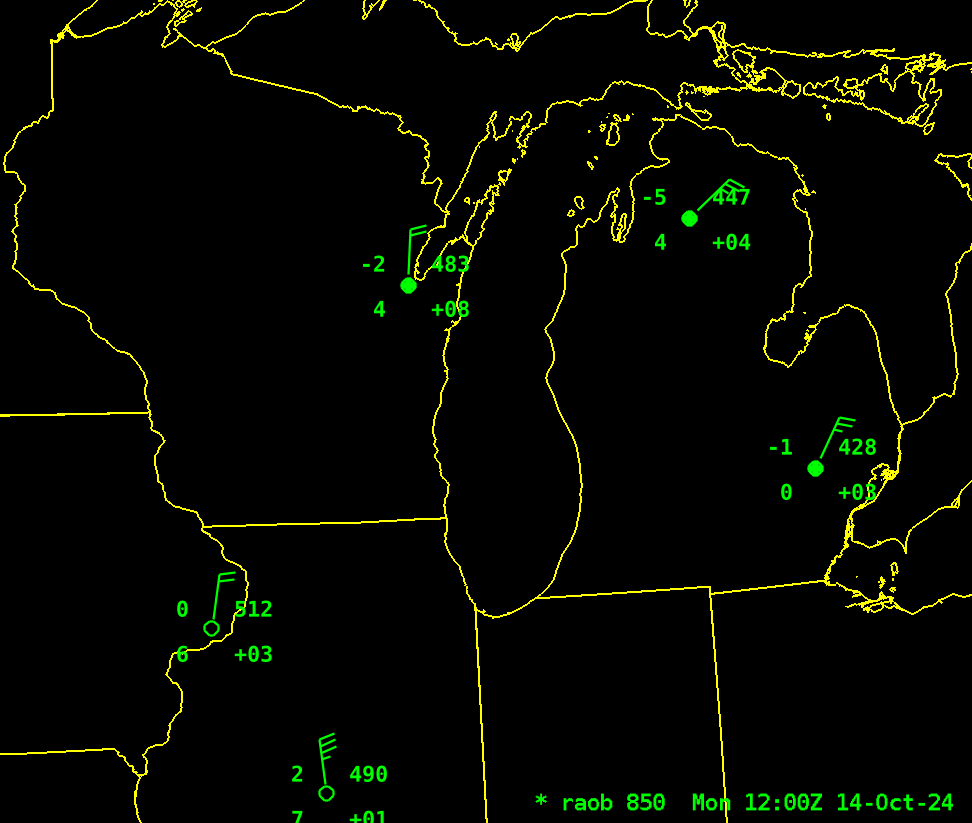
The toggle from 1201 UTC, below, shows the band in the Night Microphysics RGB with NEXRAD reflectivity overlain, and also surface and 850-mb observations. Note the 850-mb temperatures at Green Bay (-2o C) and at Detroit (-1o C) and at Gaylord MI (-5o C).
GOES-16 Night Microphysics along with NEXRAD Reflectivity, Surface Observations and 850-mb RAOB plots (Click to enlarge)
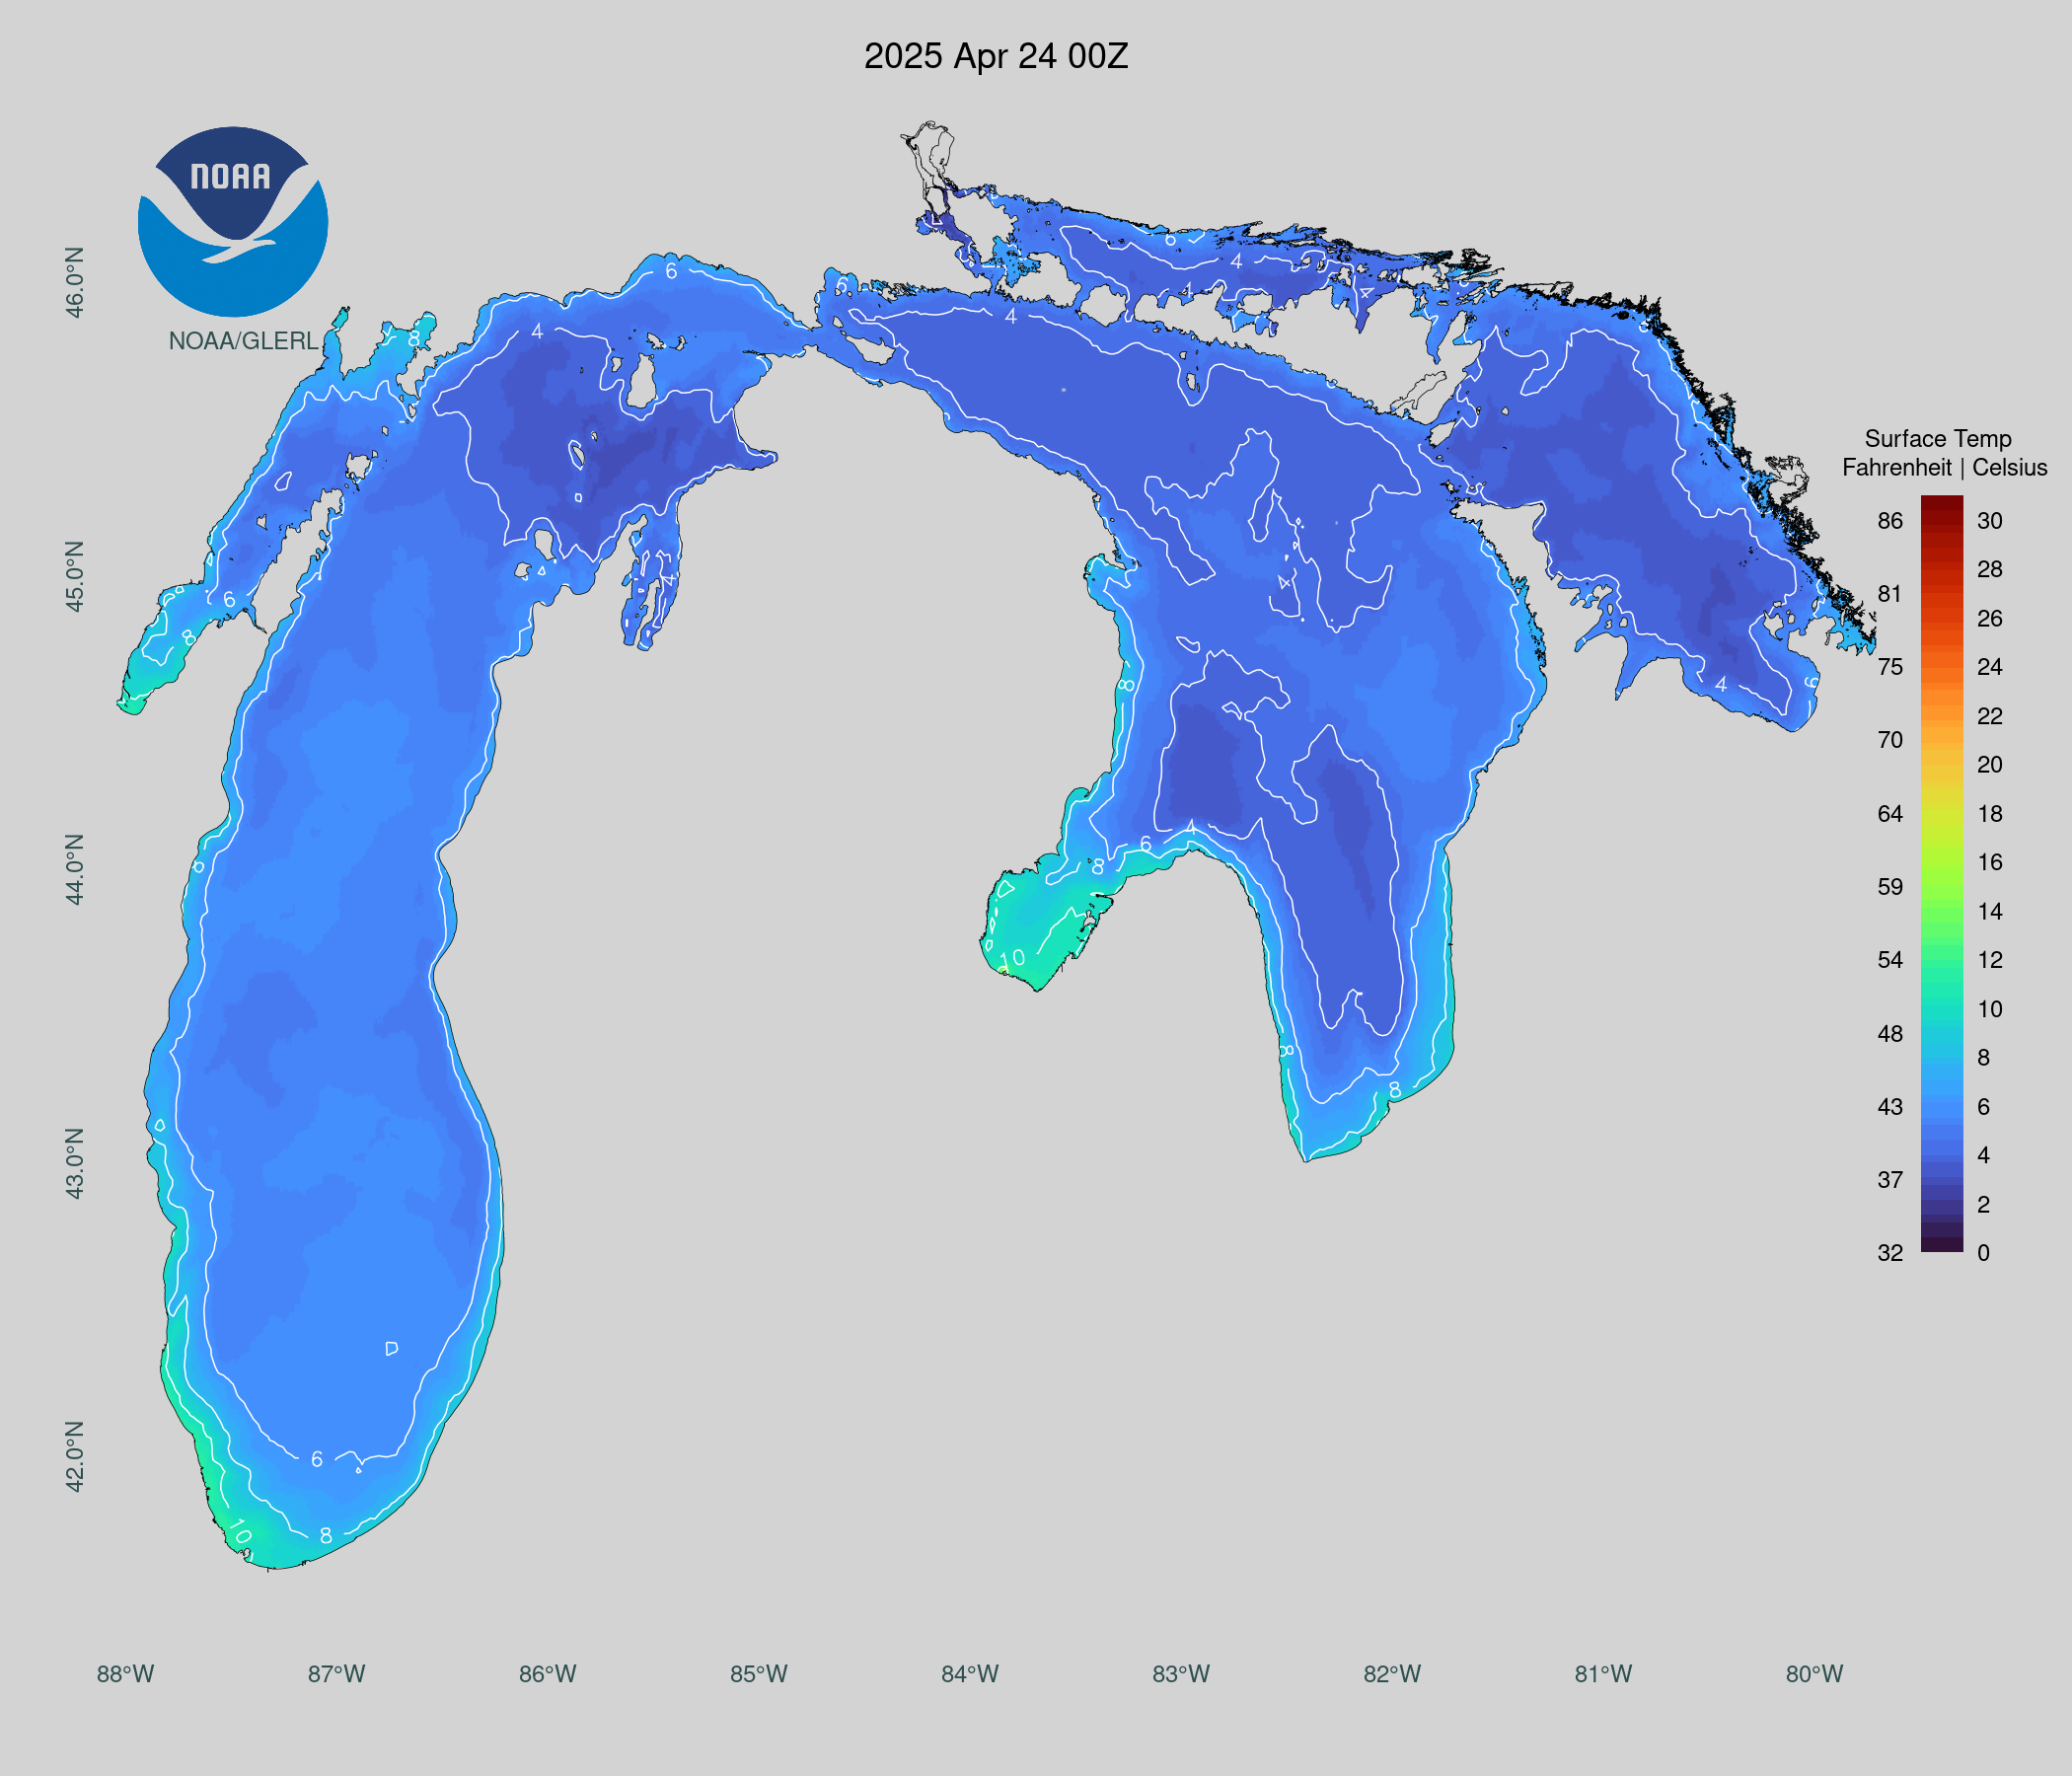
The temperatures at 850-mb are below zero (Celsius) and Lake Surface Temperatures are in the 17-18oC range (below, source). That difference is greater than the ca. 13 Celsius degrees needed to support Lake Effect bands.
Diagnosed Lake Surface Temperatures, 1200 UTC on 14 October 2024 (Click to enlarge)


