The Storm Prediction Center’s Fire Weather Outlook, issued at 1700 UTC on 28 October (link), shown below, shows a critical weather day over portions of Oklahoma, Kansas and Texas. The forecast office in Norman, OK, noted the fire risk, Red Flag Warnings and Wind Advisories on its front page.
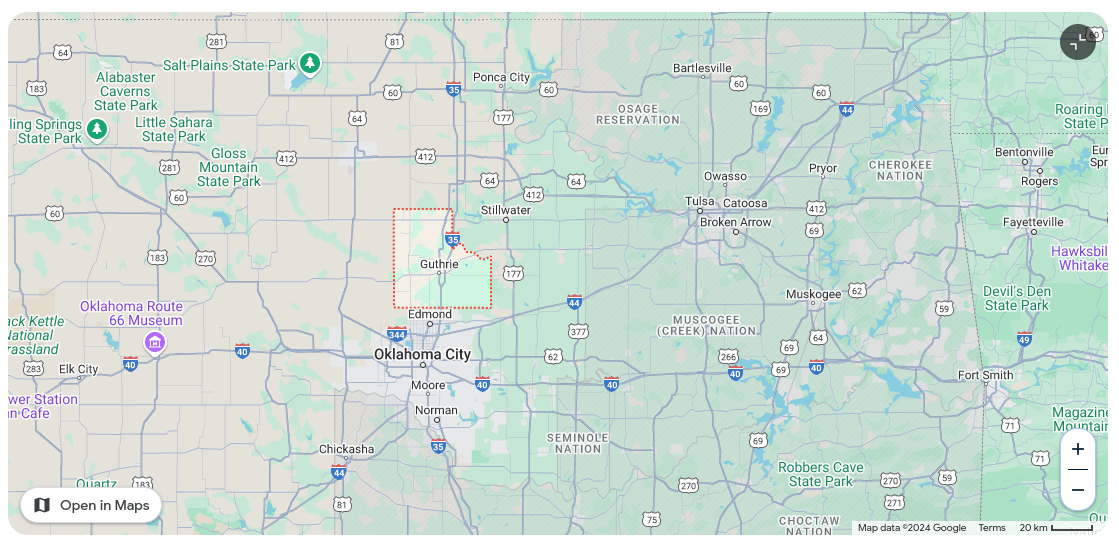
The Next Generation Fire System Alerts Dashboard monitors satellite imagery to detect the hot spots that indicate wildfires. A screen capture of the Alerts Dashboard is shown below (The Alerts Dashboard has been modified so only alerts in TX and OK are shown), with an alert shown for Logan County in OK, north of Oklahoma City OK. By clicking on the triangle, satellite data associated with alert can be accessed.

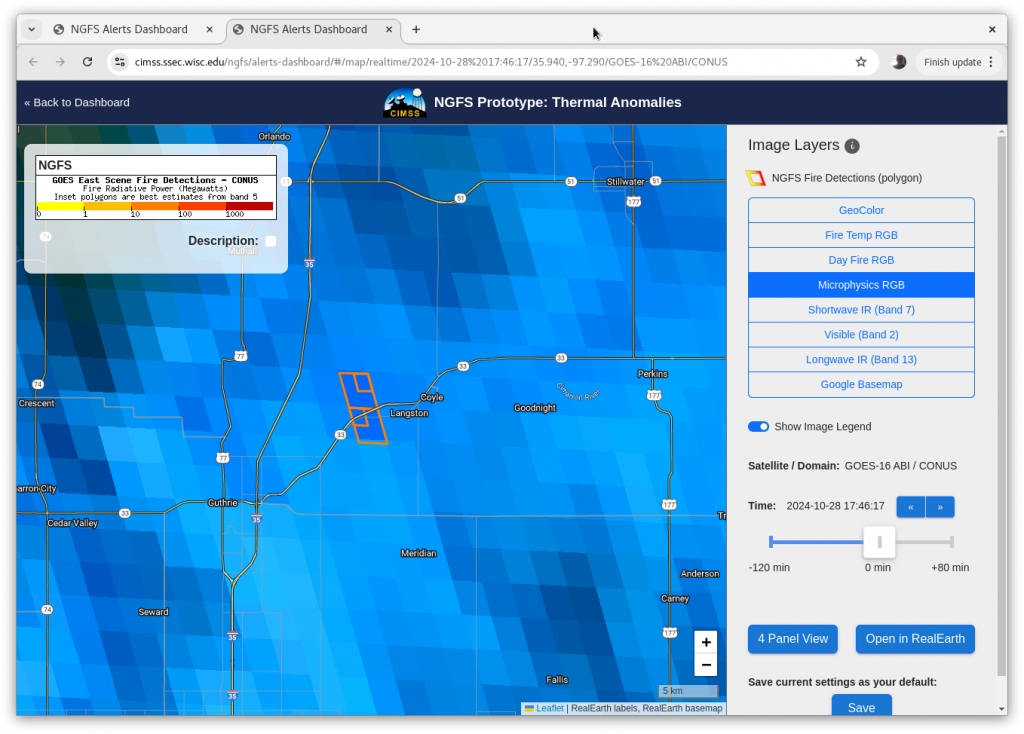
The satellite imagery revealed once a user clicks on ‘Satellite Imagery’ above is shown below. This shows the NGFS Microphysics RGB. In addition, the pixels where the fire has been detected are highlighted; the color of the pixel outline is a function of the estimated GOES-R derived Fire Radiative Power. The slider allows a user to move forward and backward in time to help conclude if action is required. Note also the button that says ‘Open in RealEarth’. That opens a RealEarth instance that includes all the NGFS fire products.
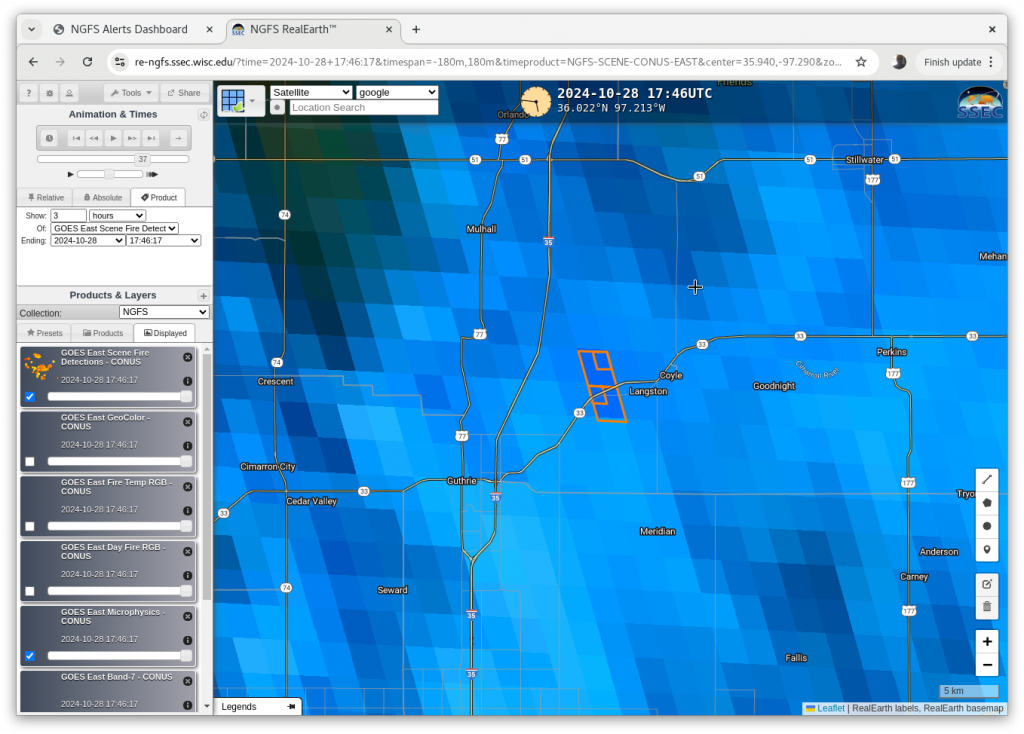
The RealEarth instance of NGFS, for the same time, is shown below.
The animation below shows Fire Temperature RGB and NGFS Microphysics RGB animations from 1721 to 1836 UTC. The fire detection in both RGBs shows up at 1746 UTC. High clouds mean it is a challenge to maintain the RGB signal, but the NGFS signal persists as high clouds move overhead.
CSPP Geosphere true-color imagery, below, shows a complicated scene. The moving high clouds make it difficult to identify — visually — any fire detections.
The CIMSS Prototype NGFS website is here.
View only this post Read Less


