The terminator was also seen on GOES-15 (GOES-West) Visible (0.63 µm, 1-km resolution) images (below), albeit a few hours later. Note that areas of northern Canada and northern Alaska remain dark during the entire day; for example, at Barrow (the northernmost city in Alaska), their polar night — the period with no sunlight — lasts about 65 days, from mid-November to late January.
For a global perspective, we can examine Himawari-8 true-color Red/Green/Blue (RGB) images (below), which cover the period before, during, and after the 0448 UTC solstice time — the animation pauses briefly on the 0450 UTC image, nearest the time of the solstice (also available as longer MP4 movie file). One feature that stands out quite prominently (due to a favorable forward scattering angle) is the dense haze covering much of the Indian subcontinent and the adjacent offshore waters. These images were generated using an update (version 2) of the Simple Hybrid Contrast Stretch (SHCS) method, which uses the AHI 0.86 µm band to “boost” the green of the 0.51 µm band, and stretches each of the 3 color components (R/G/B) on both the dark and light ends. Similar full-disk true-color images will be available every 5 minutes from the ABI instrument on GOES-R. The Himawari-8 data was provided by JMA and acquired via NOAA/NESDIS/STAR; the SSEC Data Center served the AHI data via McIDAS ADDE, and McIDAS-X was used for the processing.Some Solstice Satellite Scenes
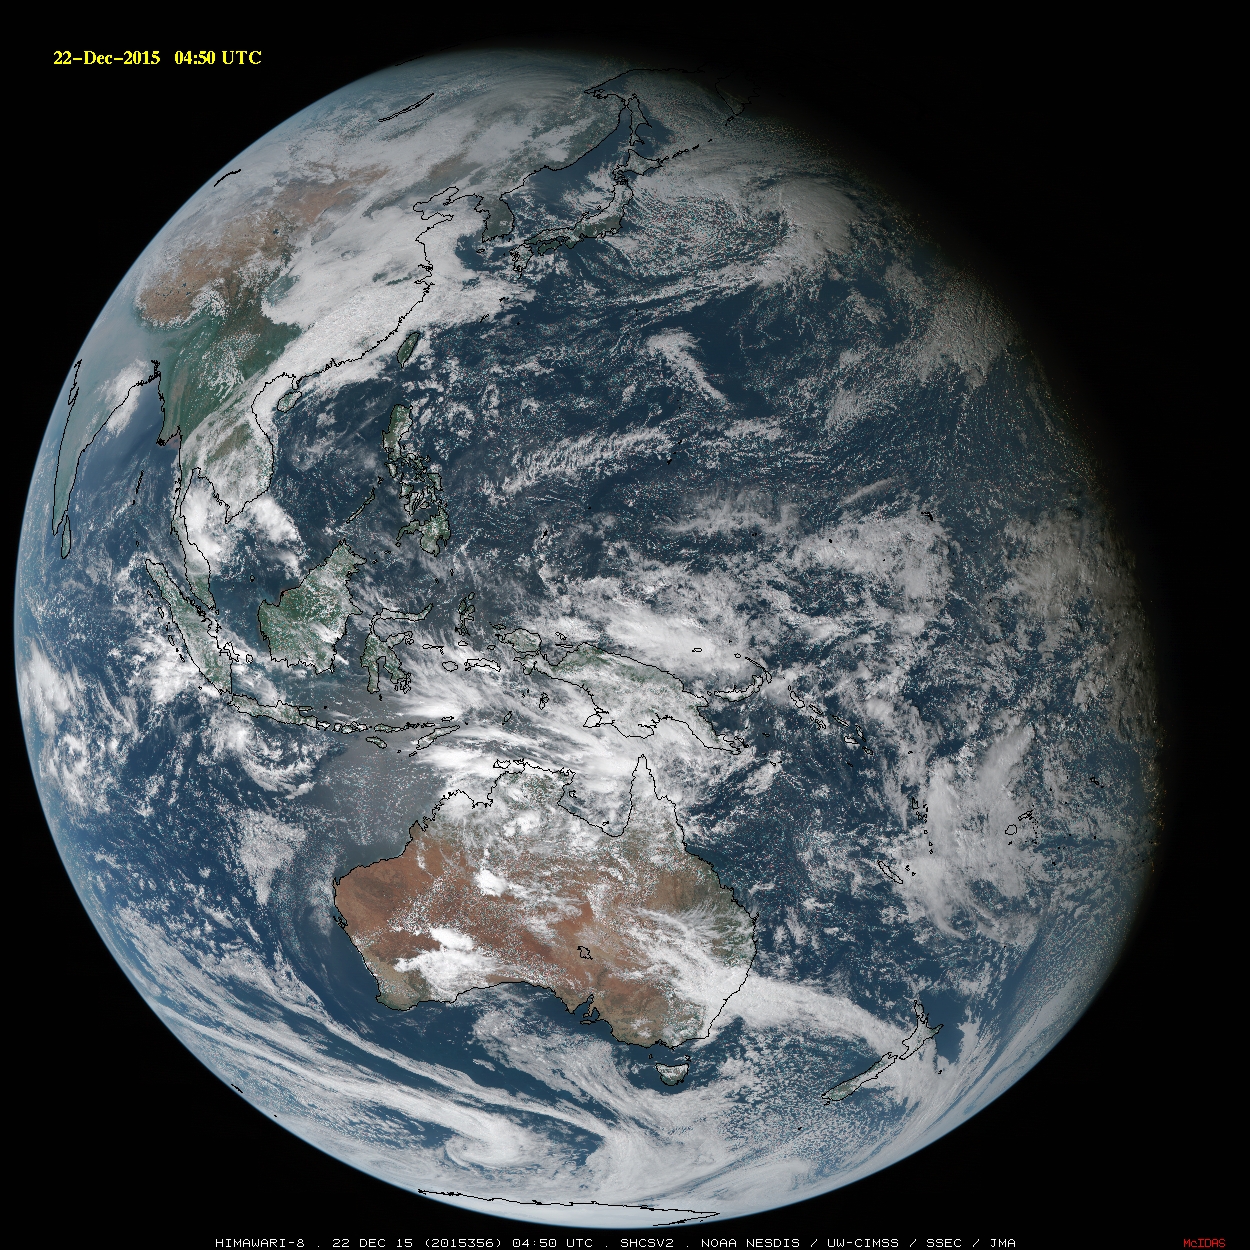
December 22nd, 2015 | Scott BachmeierLake effect clouds in North Central Texas
December 18th, 2015 | Scott BachmeierGOES-13 Fog/stratus product (10.7 µm – 3.9 µm) and Visible (0.63 µm) images [click to play animation]
Notice the low clouds south of DFW this AM? We think they are a result of area lakes! #dfwwx #txwx pic.twitter.com/JPn8MffQjA
— NWS Fort Worth (@NWSFortWorth) December 18, 2015
Meso-vortex over Qinghai Lake, China
December 18th, 2015 | Scott BachmeierWe received the following notification on Twitter from Walt Clark:
great meso-B MCV over Qinghai Lake in first light himawari 2230-630+Z. tough to get a good image loop of it tho. @CIMSS_Satellite
— Walt Clark (@waclark4) December 18, 2015
Good catch Walt, and thanks for the heads-up! Using the Location Search feature of RealEarth, we found that Qinghai Lake is located in central China, and Wikipedia told us it’s also the largest lake in China. (Qinghai Lake is slightly smaller than the Great Salt Lake in Utah) The mesoscale vortex can be seen over the lake on a Himawari-8 true-color Red/Green/Blue (RGB) image at 0400 UTC on 18 December 2015 (below).
Daytime Himawari-8 Visible (0.64 µm, 0.5-km resolution) images (below) showed the feature spinning cyclonically over Qinghai Lake as it slowly migrated northward. However, we’re not certain that this was a Mesoscale Convective Vortex (MCV); while there was some convection over the mountains north of the lake during the preceding nighttime hours on 17 December which exhibited cloud-top IR brightness temperatures around -40º C (color-enhanced Himawari-8 Infrared animation), it appears more likely that this might have been a convective outflow boundary from those mountain thunderstorms which became trapped within the “bowl” of high terrain that nearly surrounds the lake. A long animation which concatenates the earlier nighttime Himawari-8 Infrared (10.4 µm, 2-km resolution) and the later daytime Himawari-8 Visible (0.64 µm, 0.5-km resolution) images is shown below. It is difficult to trace the origin of the vortex feature as being from the aforementioned convective activity. The meso-vortex was also seen on a MODIS true-color RGB image from the Aqua satellite, which did an overpass of the region around 0642 UTC (below). While some small patches of ice did appear to be forming along the edges of Qinghai Lake, it remained predominantly ice-free (unlike the smaller and presumably more shallow Har Lake to the northwest, which looked to be totally ice-covered).Using RGB images for discrimination of clouds vs snow cover
December 16th, 2015 | Scott BachmeierComparing the false-color RGB image with the visible image made it easier to unambiguously discriminate between snow cover and supercooled water droplet cloud features (which appear as shades of white on the RGB image). In addition, consecutive VIIRS RGB images (below) showed the areas where snow cover was beginning to melt during the ~102 minutes between overpasses of the Suomi NPP satellite.
A late-morning overpass of the Landsat-8 satellite provided a 30-meter resolution view (below) of the circular and rectangular irrigated agricultural fields in far southwestern Kansas and parts of the Oklahoma panhandle. In this RGB image (viewed using RealEarth), snow cover appears as cyan; in areas without snow cover, bare ground is brown and vegetation (crops) are green.