Regarding the large arc of waves along the back edge of the MCS, GOES-13 (GOES-East) water vapor (6.5 µm) images (below; click image to play animation) revealed a signal of strong subsidence (warming/drying, darker blue color enhancement) as the westward-expanding cloud mass was acting as an obstacle to the prevailing westerly winds coming from Wyoming and Montana.
Mesoscale Convective System in South Dakota
August 27th, 2015 | Scott Bachmeier
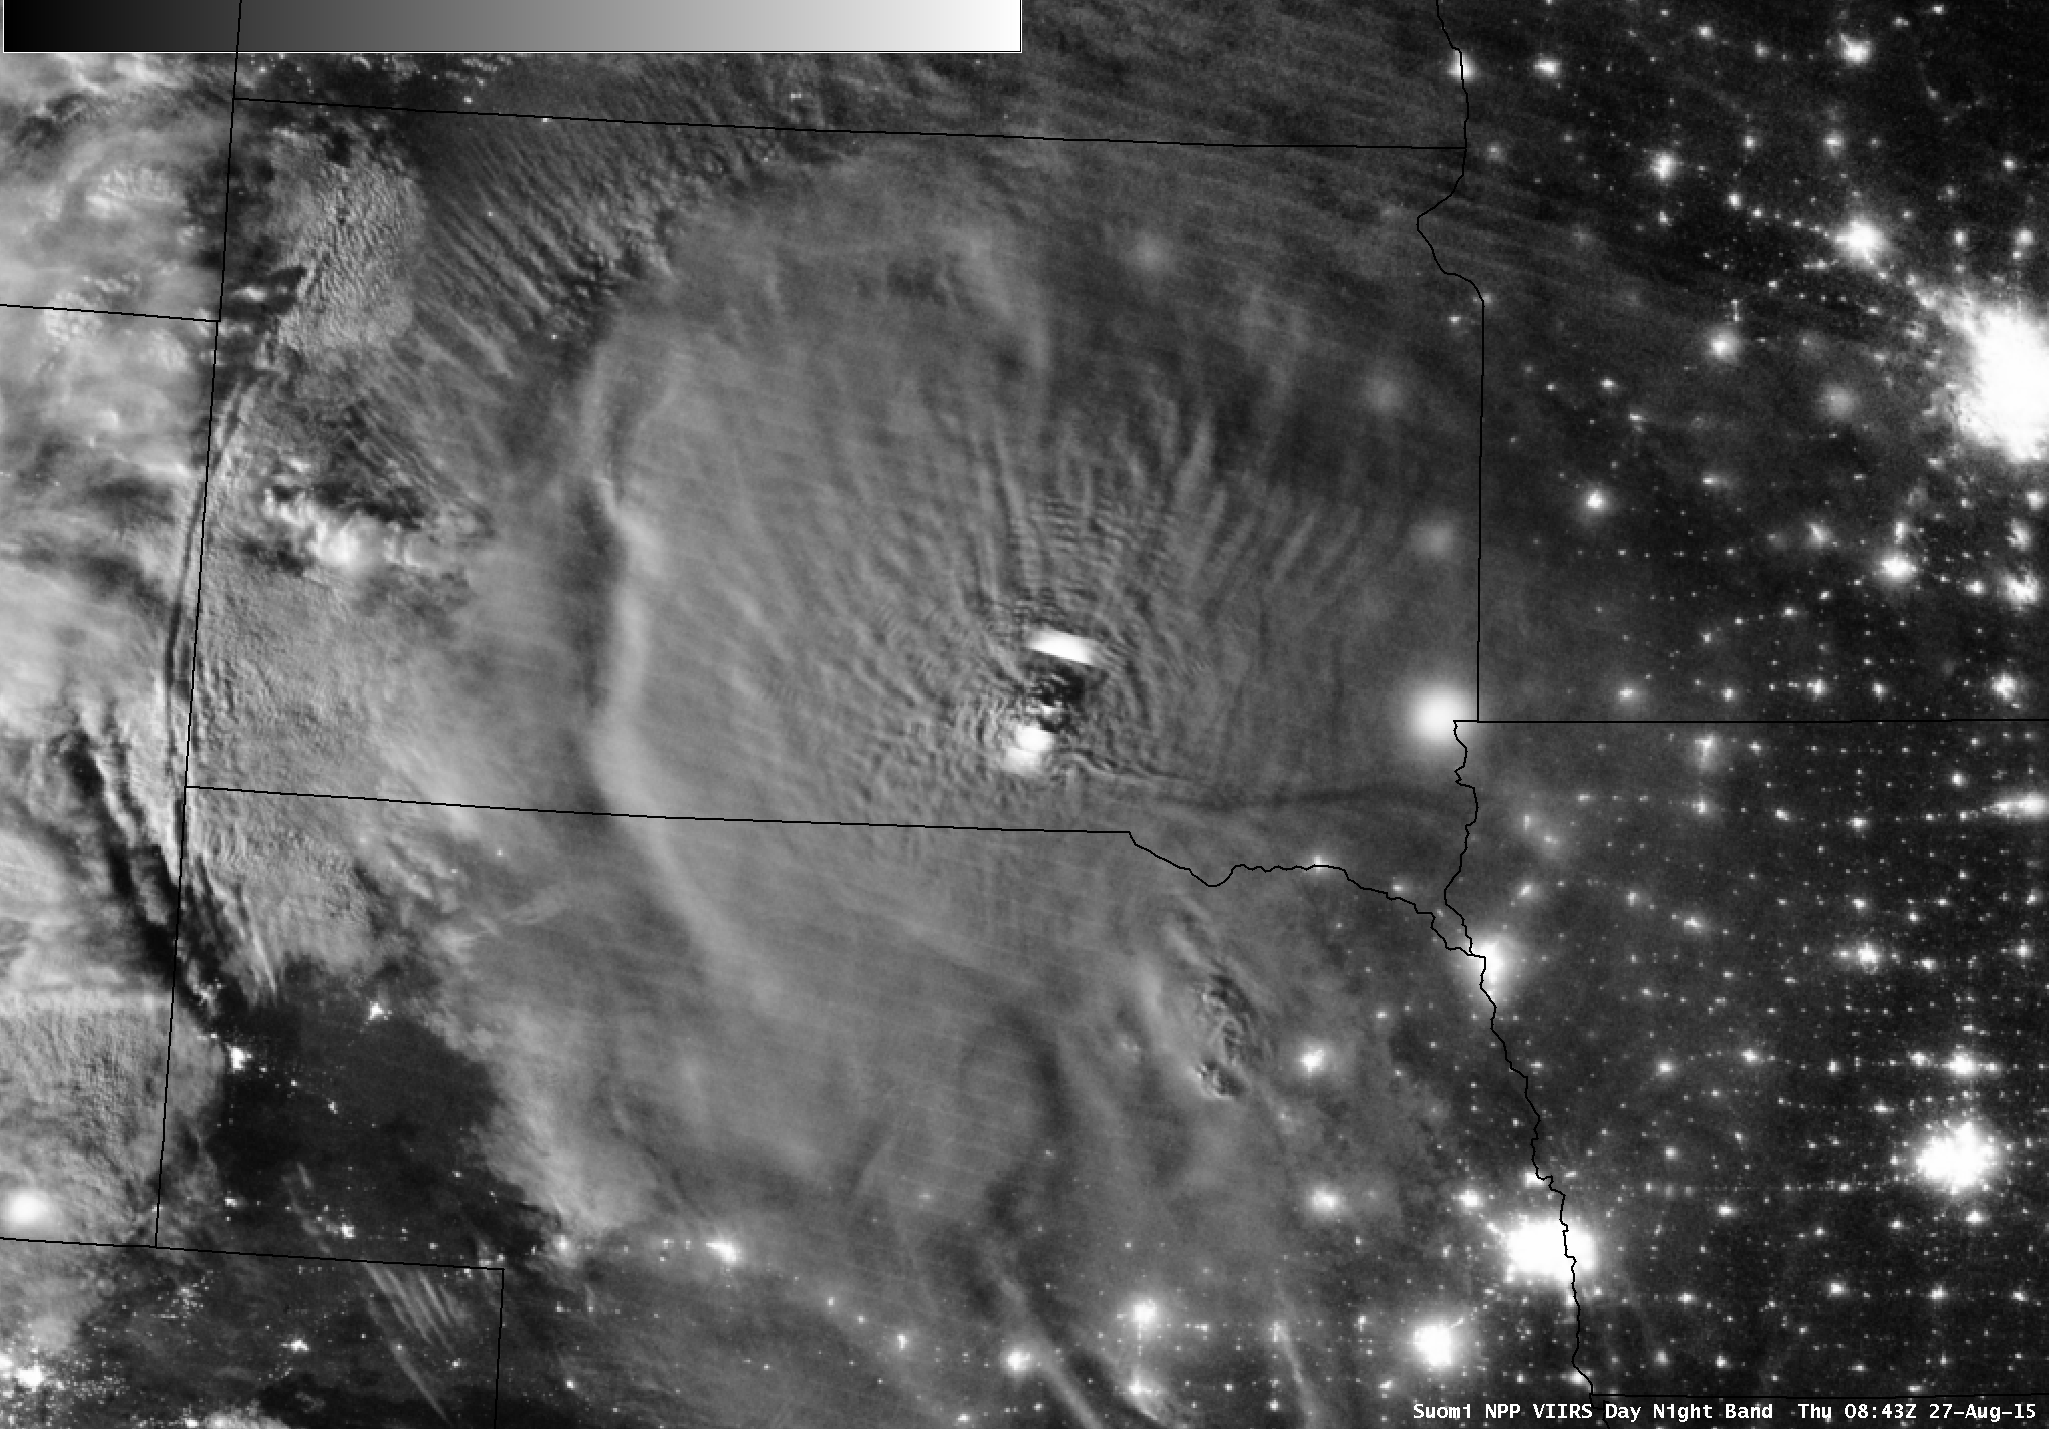
A large Mesoscale Convective System (MCS) developed over western South Dakota late in the day on 26 August 2015, moving eastward across the state and producing wind gusts as high as 79 mph (SPC storm reports). A nighttime comparison of Suomi NPP VIIRS Infrared (11.45 µm) and Day/Night Band (0.7 µm) images at 0842 UTC (above) showed the large cloud shield with cloud-top IR brightness temperatures as cold as -74º C at the central cluster of overshooting tops; bright white pixels on the Day/Night Band image were portions of the cloud illuminated by intense lightning activity. Various types of waves were also seen in the VIIRS imagery: (1) concentric gravity waves propagating outward from the central cluster of overshooting tops, (2) transverse banding emanating radially outward in portions of the northern semicircle of the MCS, and (3) a large arc of waves moving westward away from the back edge of the storm.
Tropical Storm Erika approaches the eastern Caribbean
August 26th, 2015 | Scott Lindstrom
GOES-13 Infrared Imagery (above) for the 24 hours ending 1415 UTC on 26 August 2015 show Tropical Storm Erika approaching the Leeward Islands of the eastern Caribbean. A general increase in convection in the 24 hours shown is obvious. Visible imagery (below) from the morning of 26 August shows some overshooting tops within the central dense overcast (CDO) covering the low-level circulation. A plot of the number of overshooting tops in Erika is here (taken from this webpage). Outward-propagating gravity waves can also be seen at the top of the CDO.
Surface winds as observed by the Metop ASCAT Scatterometer early on 26 August (0056 UTC), below, show a modest circulation with winds that are mostly below tropical storm force (Added: The 1411 UTC image, bottom, shows some tropical-storm force wind flags). Dry Saharan Air Layer air should not limit intensification of Erika, but wind shear just north and west of the storm is strong (SAL and Wind Shear imagery taken from the CIMSS Tropical Cyclones site).
For the most recent forecasts on Erika’s future, see the National Hurricane Center website.
The transition of Typhoon Atsani to a strong post-tropical storm
August 26th, 2015 | Scott Bachmeier
Typhoon Atsani (which reached Category 5 intensity in the West Pacific Ocean on 19 August 2015) began to transition to a strong post-tropical storm on 25 August. JMA Himawari-8 water vapor (6.2 µm) images (above; click to play MP4 animation) showed the transformation as warm/dry air (yellow to red color enhancement) began to wrap into the western and southern portion of the storm. The animation is also available as a very large QuickTime movie (76 Mbytes) or an animated GIF (110 Mbytes).
Surface analyses from the Ocean Prediction Center (below; click to play animation) indicated that the post-tropical storm deepened to a minimum central pressure of 957 hPa at 12 UTC on 25 August, and was producing hurricane-force winds until 00 UTC on 26 August.
#Atsani transitions from typhoon into powerful HF post-tropical low
impressive, short video: https://t.co/uMfMPOBh2M pic.twitter.com/InXpkA6B4Y
— NWS OPC (@NWSOPC) August 25, 2015
Hurricane Danny
August 21st, 2015 | Scott Bachmeier
1-minute interval GOES-14 SRSO-R visible images (above; click to play MP4 animation; also available as a 130 Mbyte animated GIF) showed the eye and surrounding cloud structure of Category 2 Hurricane Danny on 21 August 2015. The hazy signature of a dust-laden Saharan Air Layer (SAL) could be seen to the west, northwest, and north of the storm.
The compact circulation of Danny remained fairly “isolated” from the multiple pockets of SAL which stretched westward across much of the tropical Atlantic Ocean (above). The relatively clear dust-free air surrounding Danny was tropical moisture being wrapped northward into the circulation from the Intertropical Convergence Zone (ITCZ), as seen with the MIMIC Total Precipitable Water product (below).
A close-up view of Hurricane Danny (below; click image to play MP4 animation) showed some interesting detail in the convective bursts within the eyewall region, in spite of the very oblique satellite viewing angle. There is also a large (165 Mbyte) animated GIF available here.