LEO observations of intensifying Tropical Storm Krosa
As discussed on the CIMSS Satellite Blog on July 23rd, active tropical weather continues in the western Pacific Ocean. Specifically, the storm previously known as Invest 98W has organized into Tropical Storm Krosa, now located northwest of Guam and directly west of the Northern Mariana Islands, broadly moving north. Low-Earth Orbiting (LEO) satellite observations collected via direct broadcast by SSEC’s antenna system in Guam provides a valuable perspective on this intensifying storm in near-real time.
Above on the left is a sequence of JPSS VIIRS I-05 imagery centered over Guam between 15:30-16:30 UTC on Friday, July 25th. This is the “Legacy IR Window” band at 11.45 microns, very similar to the traditional IR imagery routinely available from geostationary satellites, albeit with higher spatial resolution. While the broad cloud shield of Krosa is easily visible, it is hard to diagnose what is going on in the lower levels of the storm. Since the time of these observations is during the local nighttime, traditional visible imagery is unavailable from both LEO and GEO platforms. However, VIIRS Adaptive Day Night band imagery (above, on the right) from the same passes, does a great job highlighting the low-level circulation of Krosa, displaced just to the north of the strongest convection.


Another valuable tool for monitoring tropical systems is the AMSR2 microwave imaging instrument aboard GCOM-W1. Above is the Level 1 36.5 GHz Horizontal Polarization brightness temperature observations over the region, on the left at 3:40 UTC on July 25th, and on the right at 15:53 UTC July 25th. This channel is particularly sensitive to the structure of precipitation in the lower portion of the atmosphere. As such, the tightening of the concentric features near the low level circulation is easy to spot over this approximately 12 hour period.

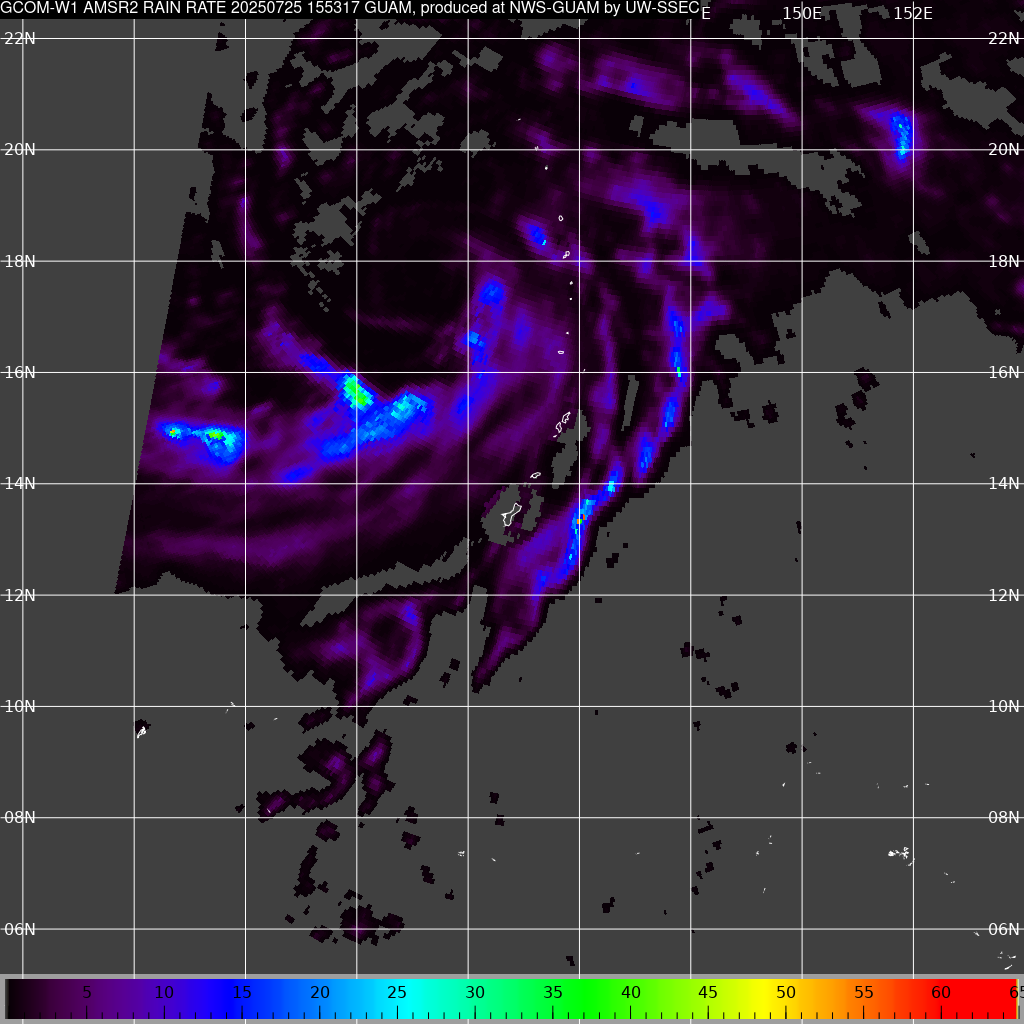
AMSR2 microwave data can also be processed to a number of Level 2 products utilizing the CSPP GAASP software package. Again, the image on the left is from 3:40 UTC July 25th, and on the right from 15:53 UTC July 25th. Comparing the two, there appears to be greater organization of the precipitation bands on the eastern and southern side of the storm in the later pass, with longer, more circular structure evident.
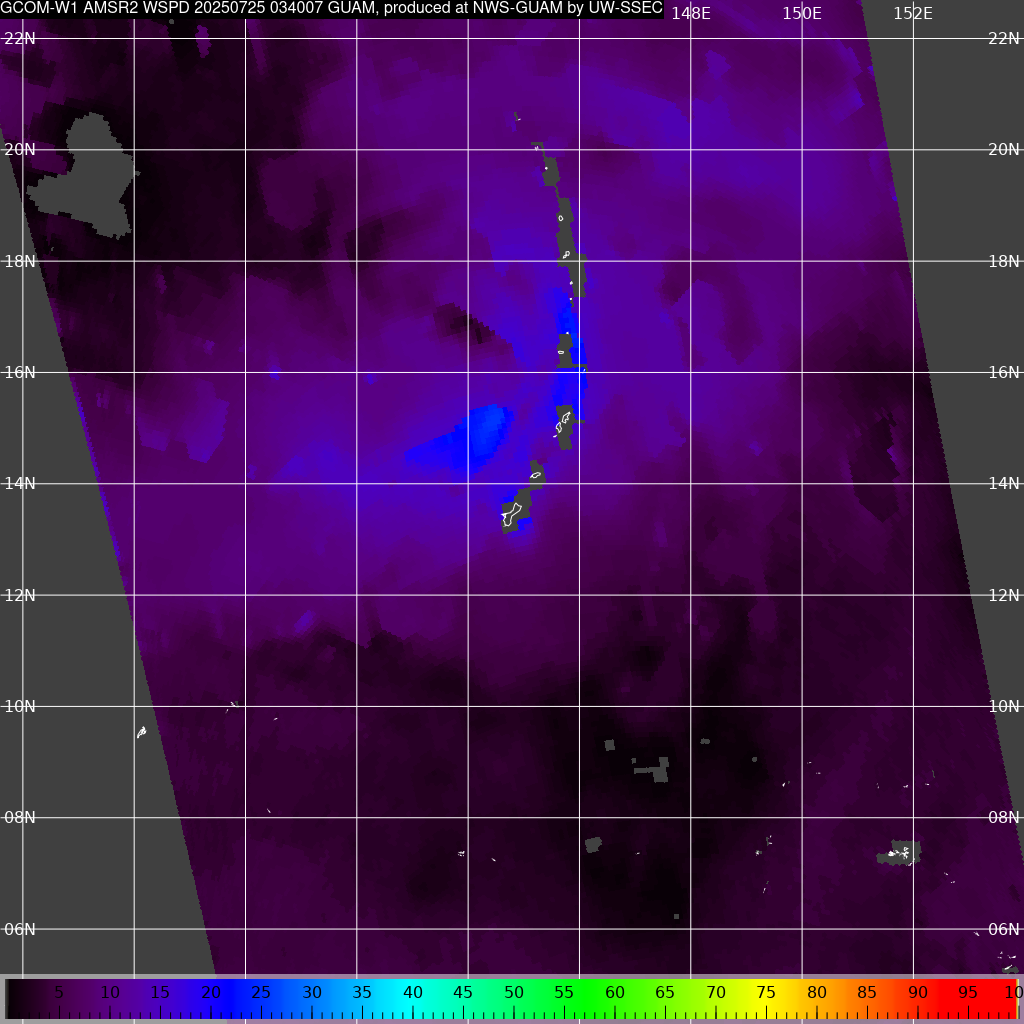
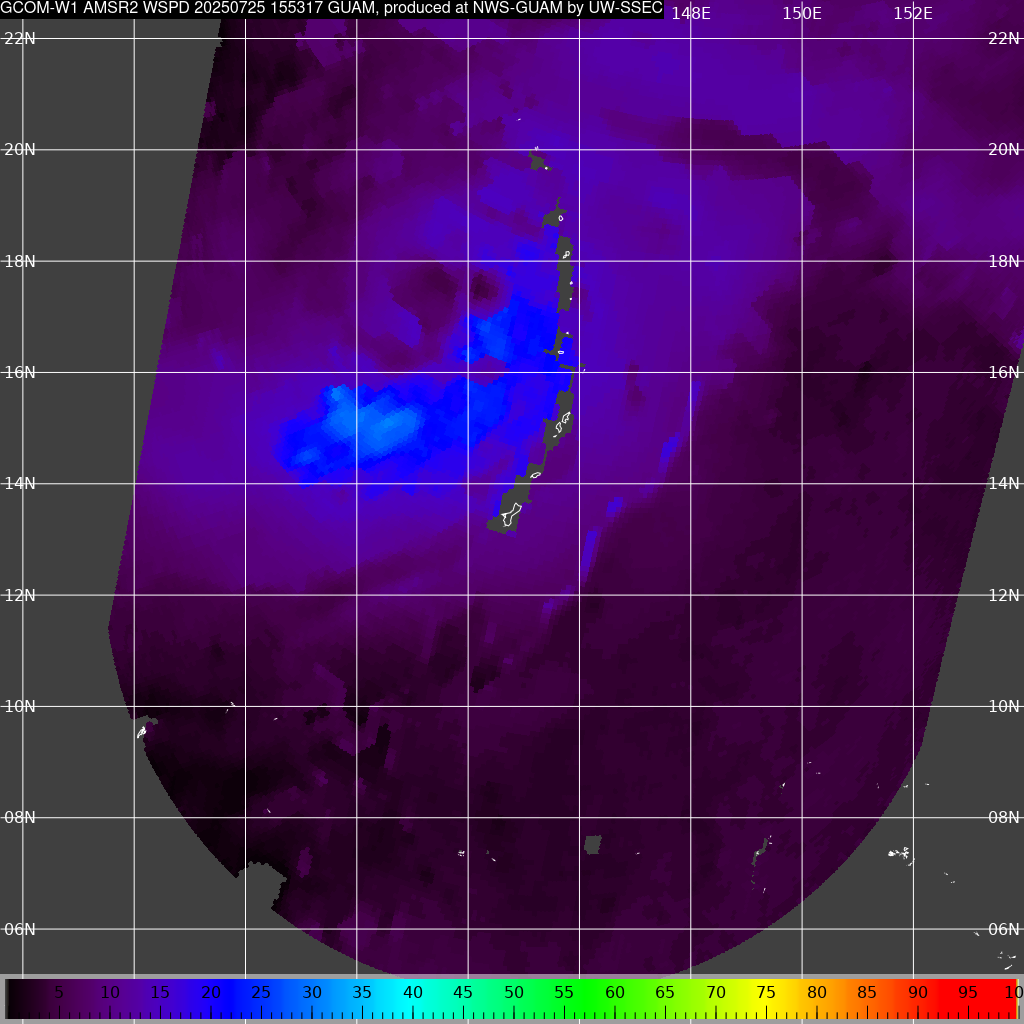
Another GAASP product, Ocean Wind Speed, provides an estimate of wind speeds over water. The time sequence matches the other products shown above. This product makes it clear that both the maximum strength and overall size of Tropical Storm Krosa’s wind field grew substantially in the roughly 12 hours between overpasses at 3:40 and 15:53 UTC. Interests in the region should continue to follow updates on the storm from the National Weather Service. All of the products featured in this post were collected and processed by SSEC’s direct broadcast antenna system in Guam (utilizing software such as CSPP Polar2Grid) and provided to the National Weather Service with low latency.