Leeside cold frontal gravity waves over the Southern Plains
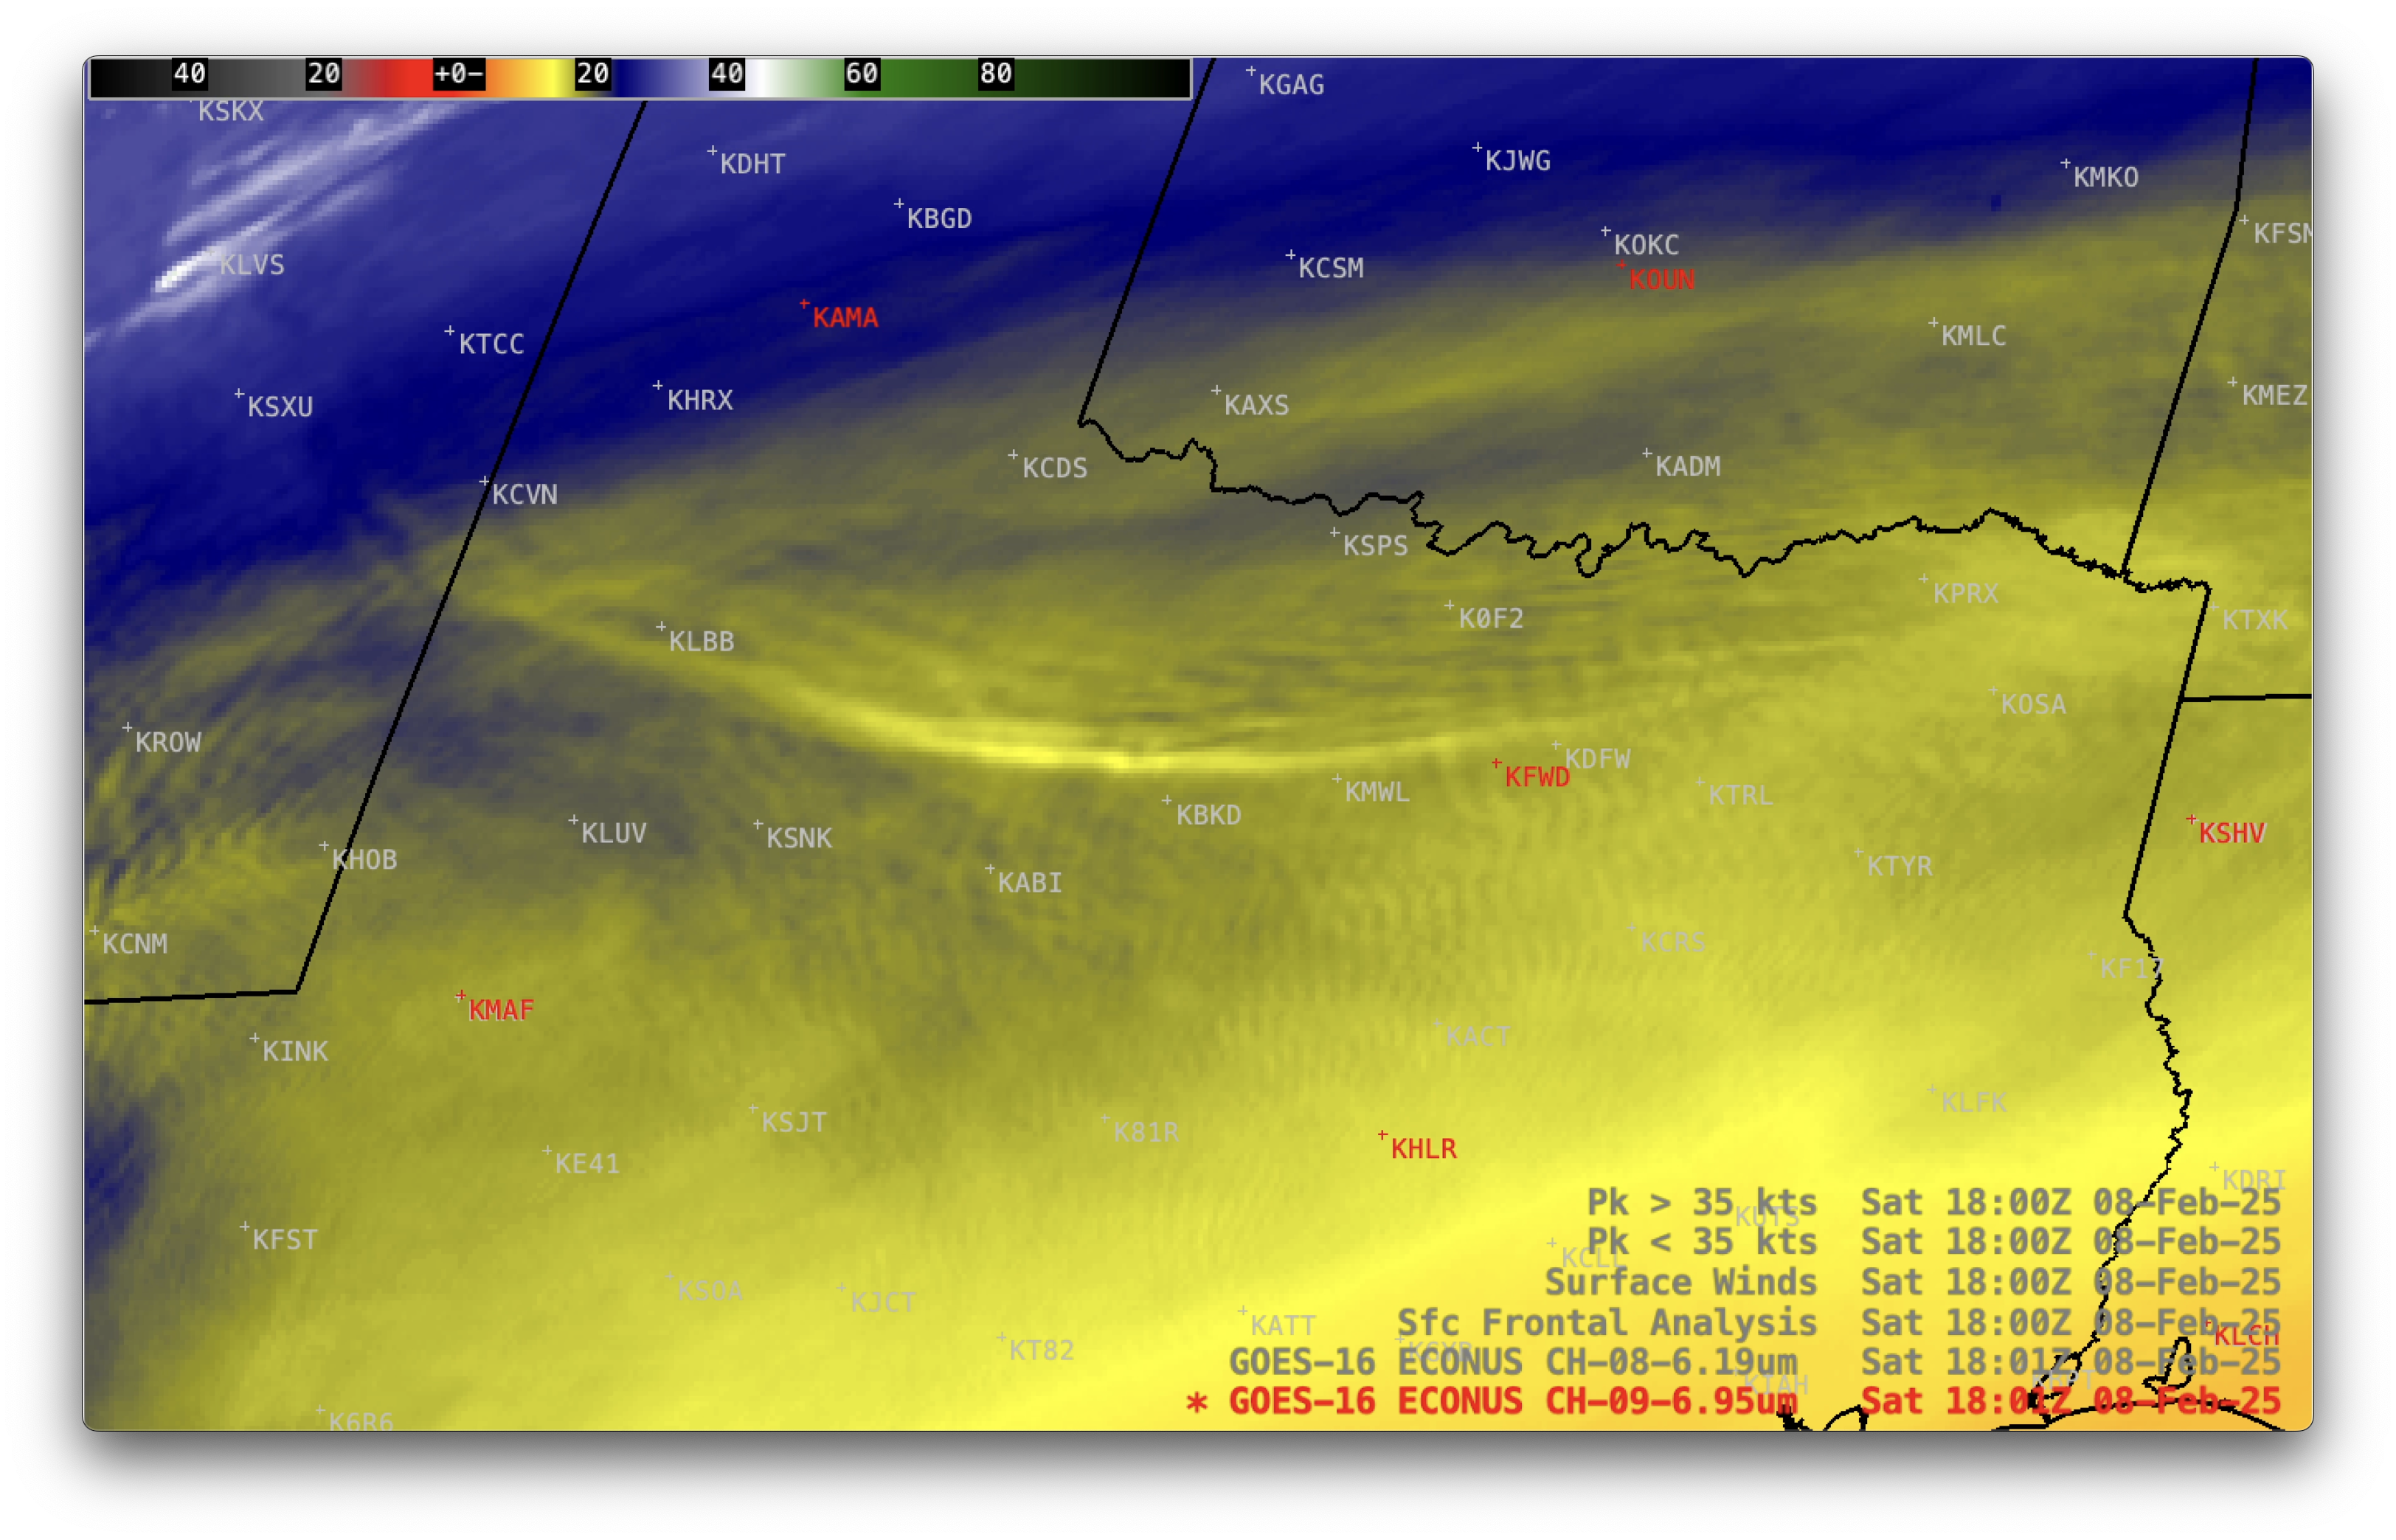
GOES-16 Upper-level Water Vapor (6.2 µm) and Mid-level Water Vapor (6.9 µm) images, from 1511 UTC on 8th February to 0001 UTC on 9th February; rawinsonde sites are plotted in red [click to play MP4 animation]
In a corresponding animation that included plots of surface wind barbs, peak wind gusts and frontal analyses (below), it could be seen that the gravity waves were generally present along or just behind the western portion of the surface cold front — while farther to the east, the gravity waves advanced ahead of the cold front.
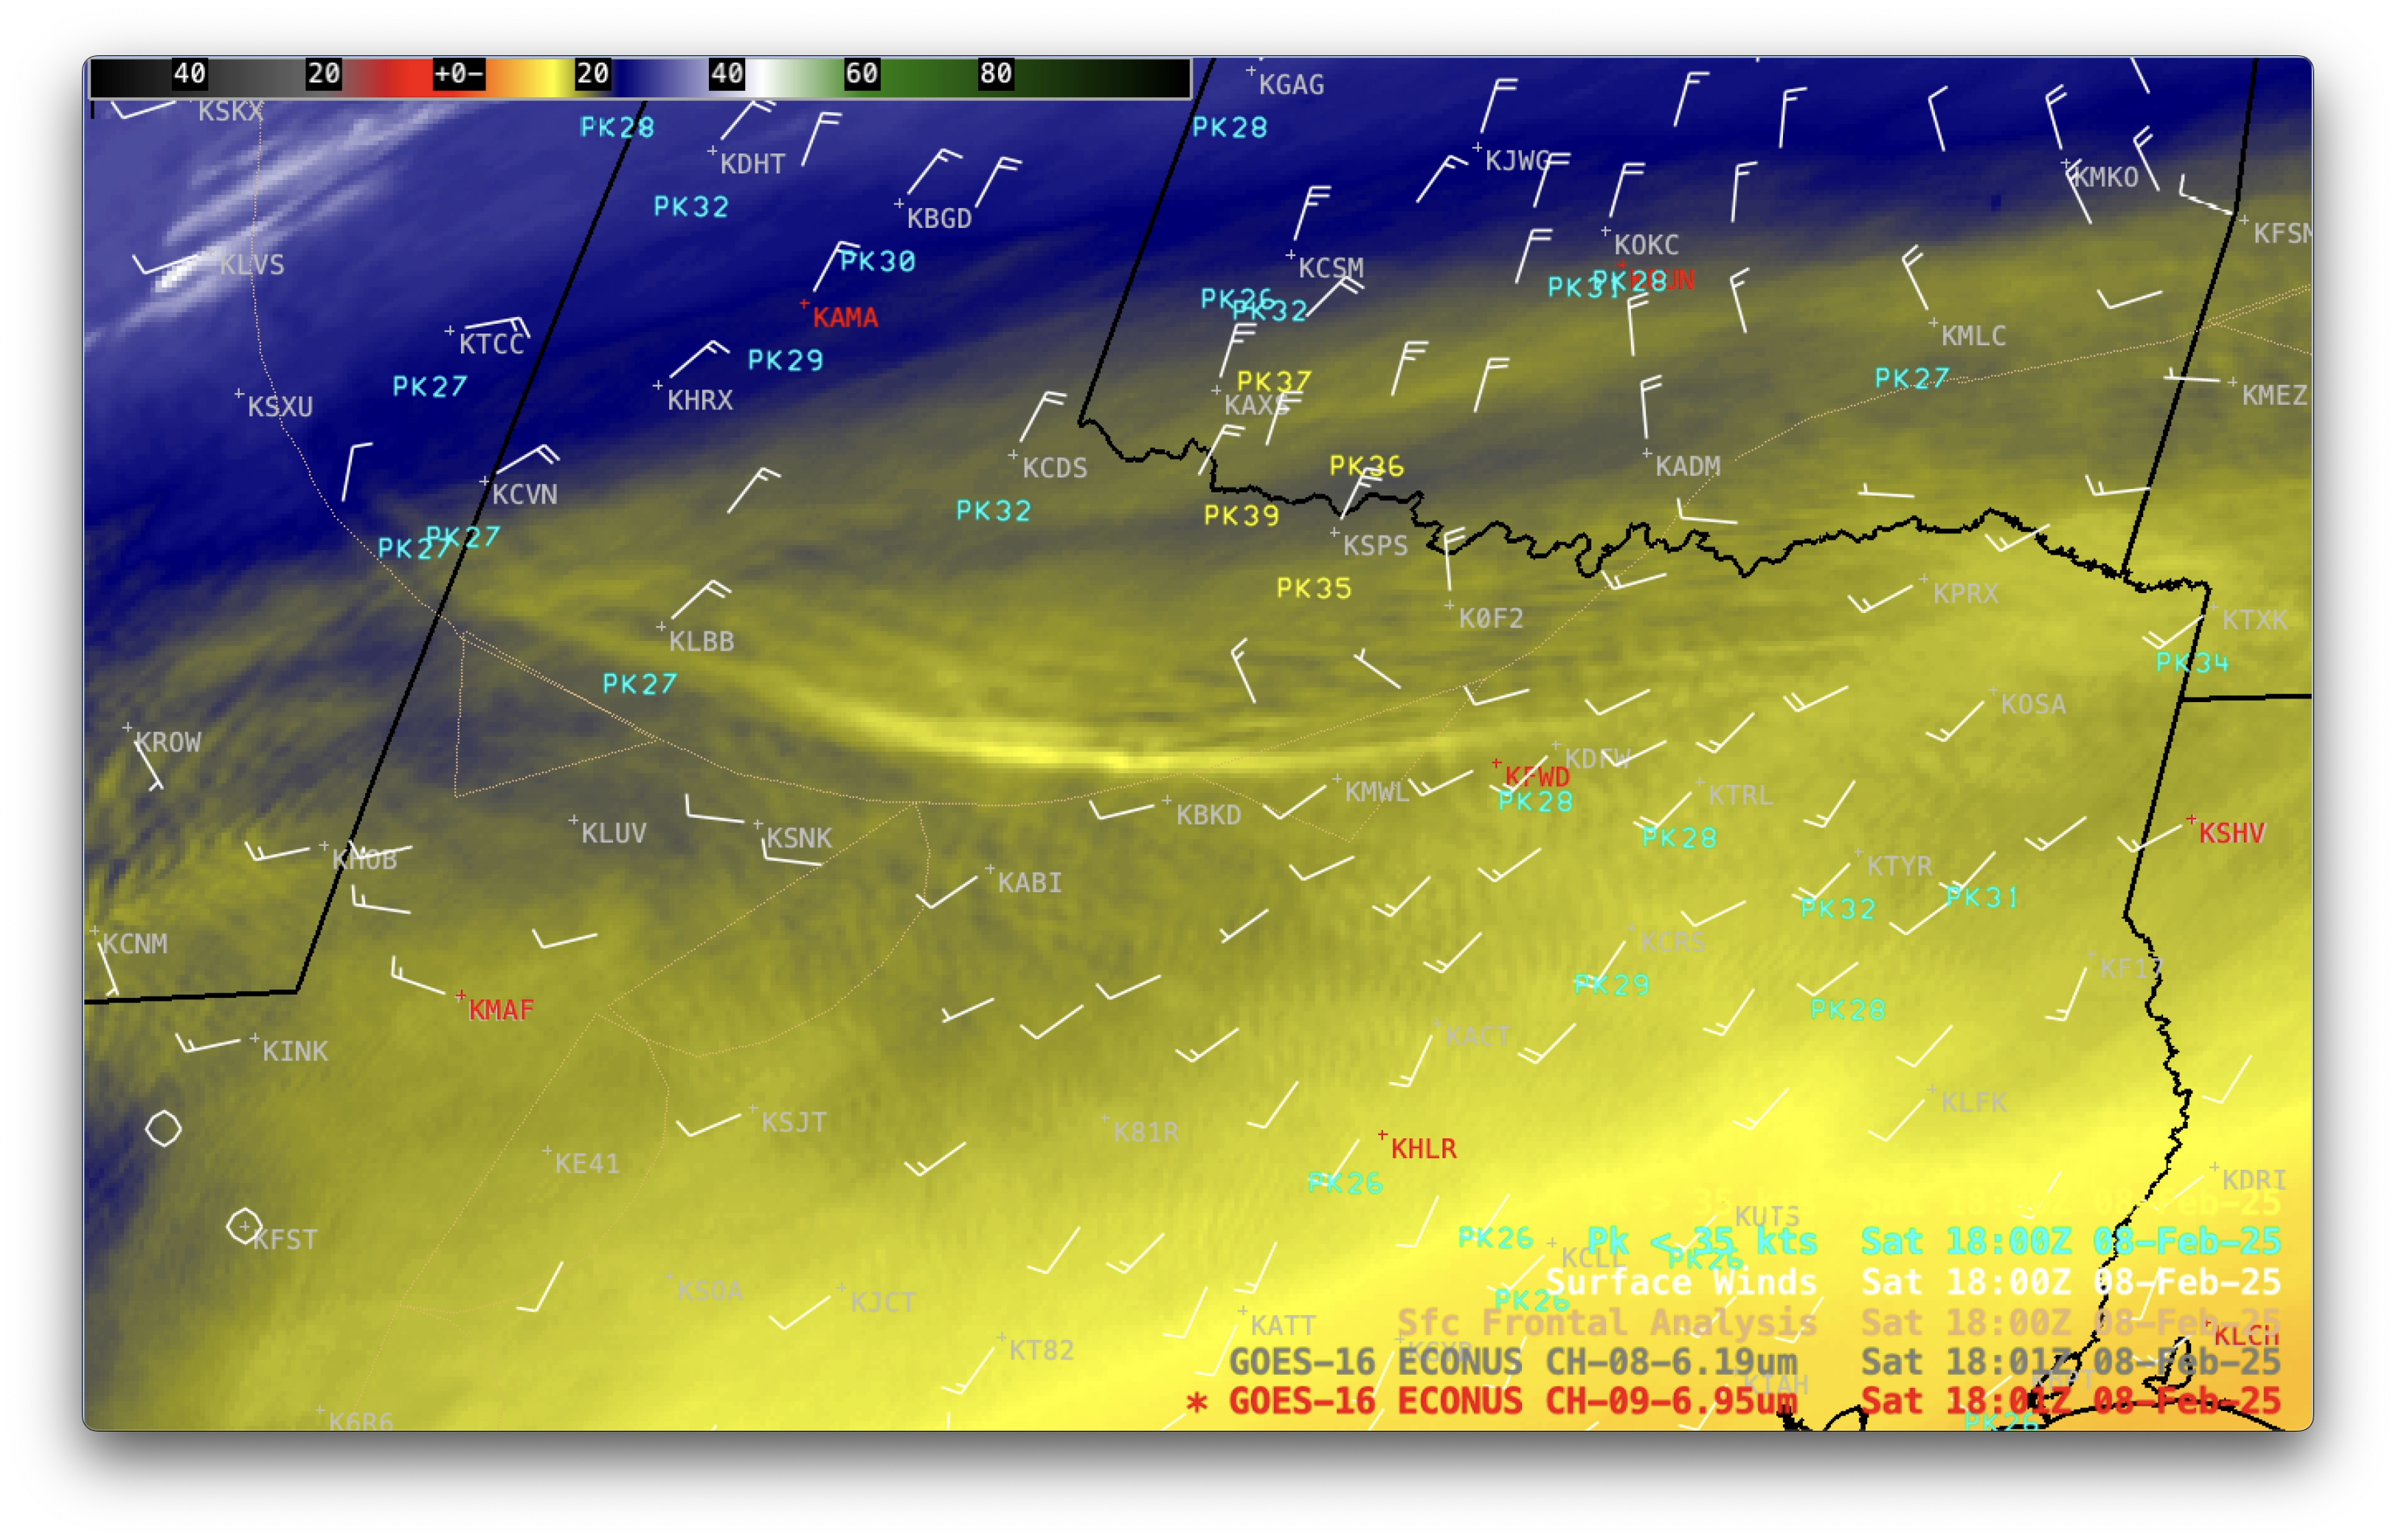
GOES-16 Upper-level Water Vapor (6.2 µm) and Mid-level Water Vapor (6.9 µm) images, with plots of hourly surface wind barbs (white), 30-minute peak wind gusts (cyan/yellow) and 3-hourly surface front analyses (beige) from 1511 UTC on 8th February to 0001 UTC on 9th February [click to play MP4 animation]
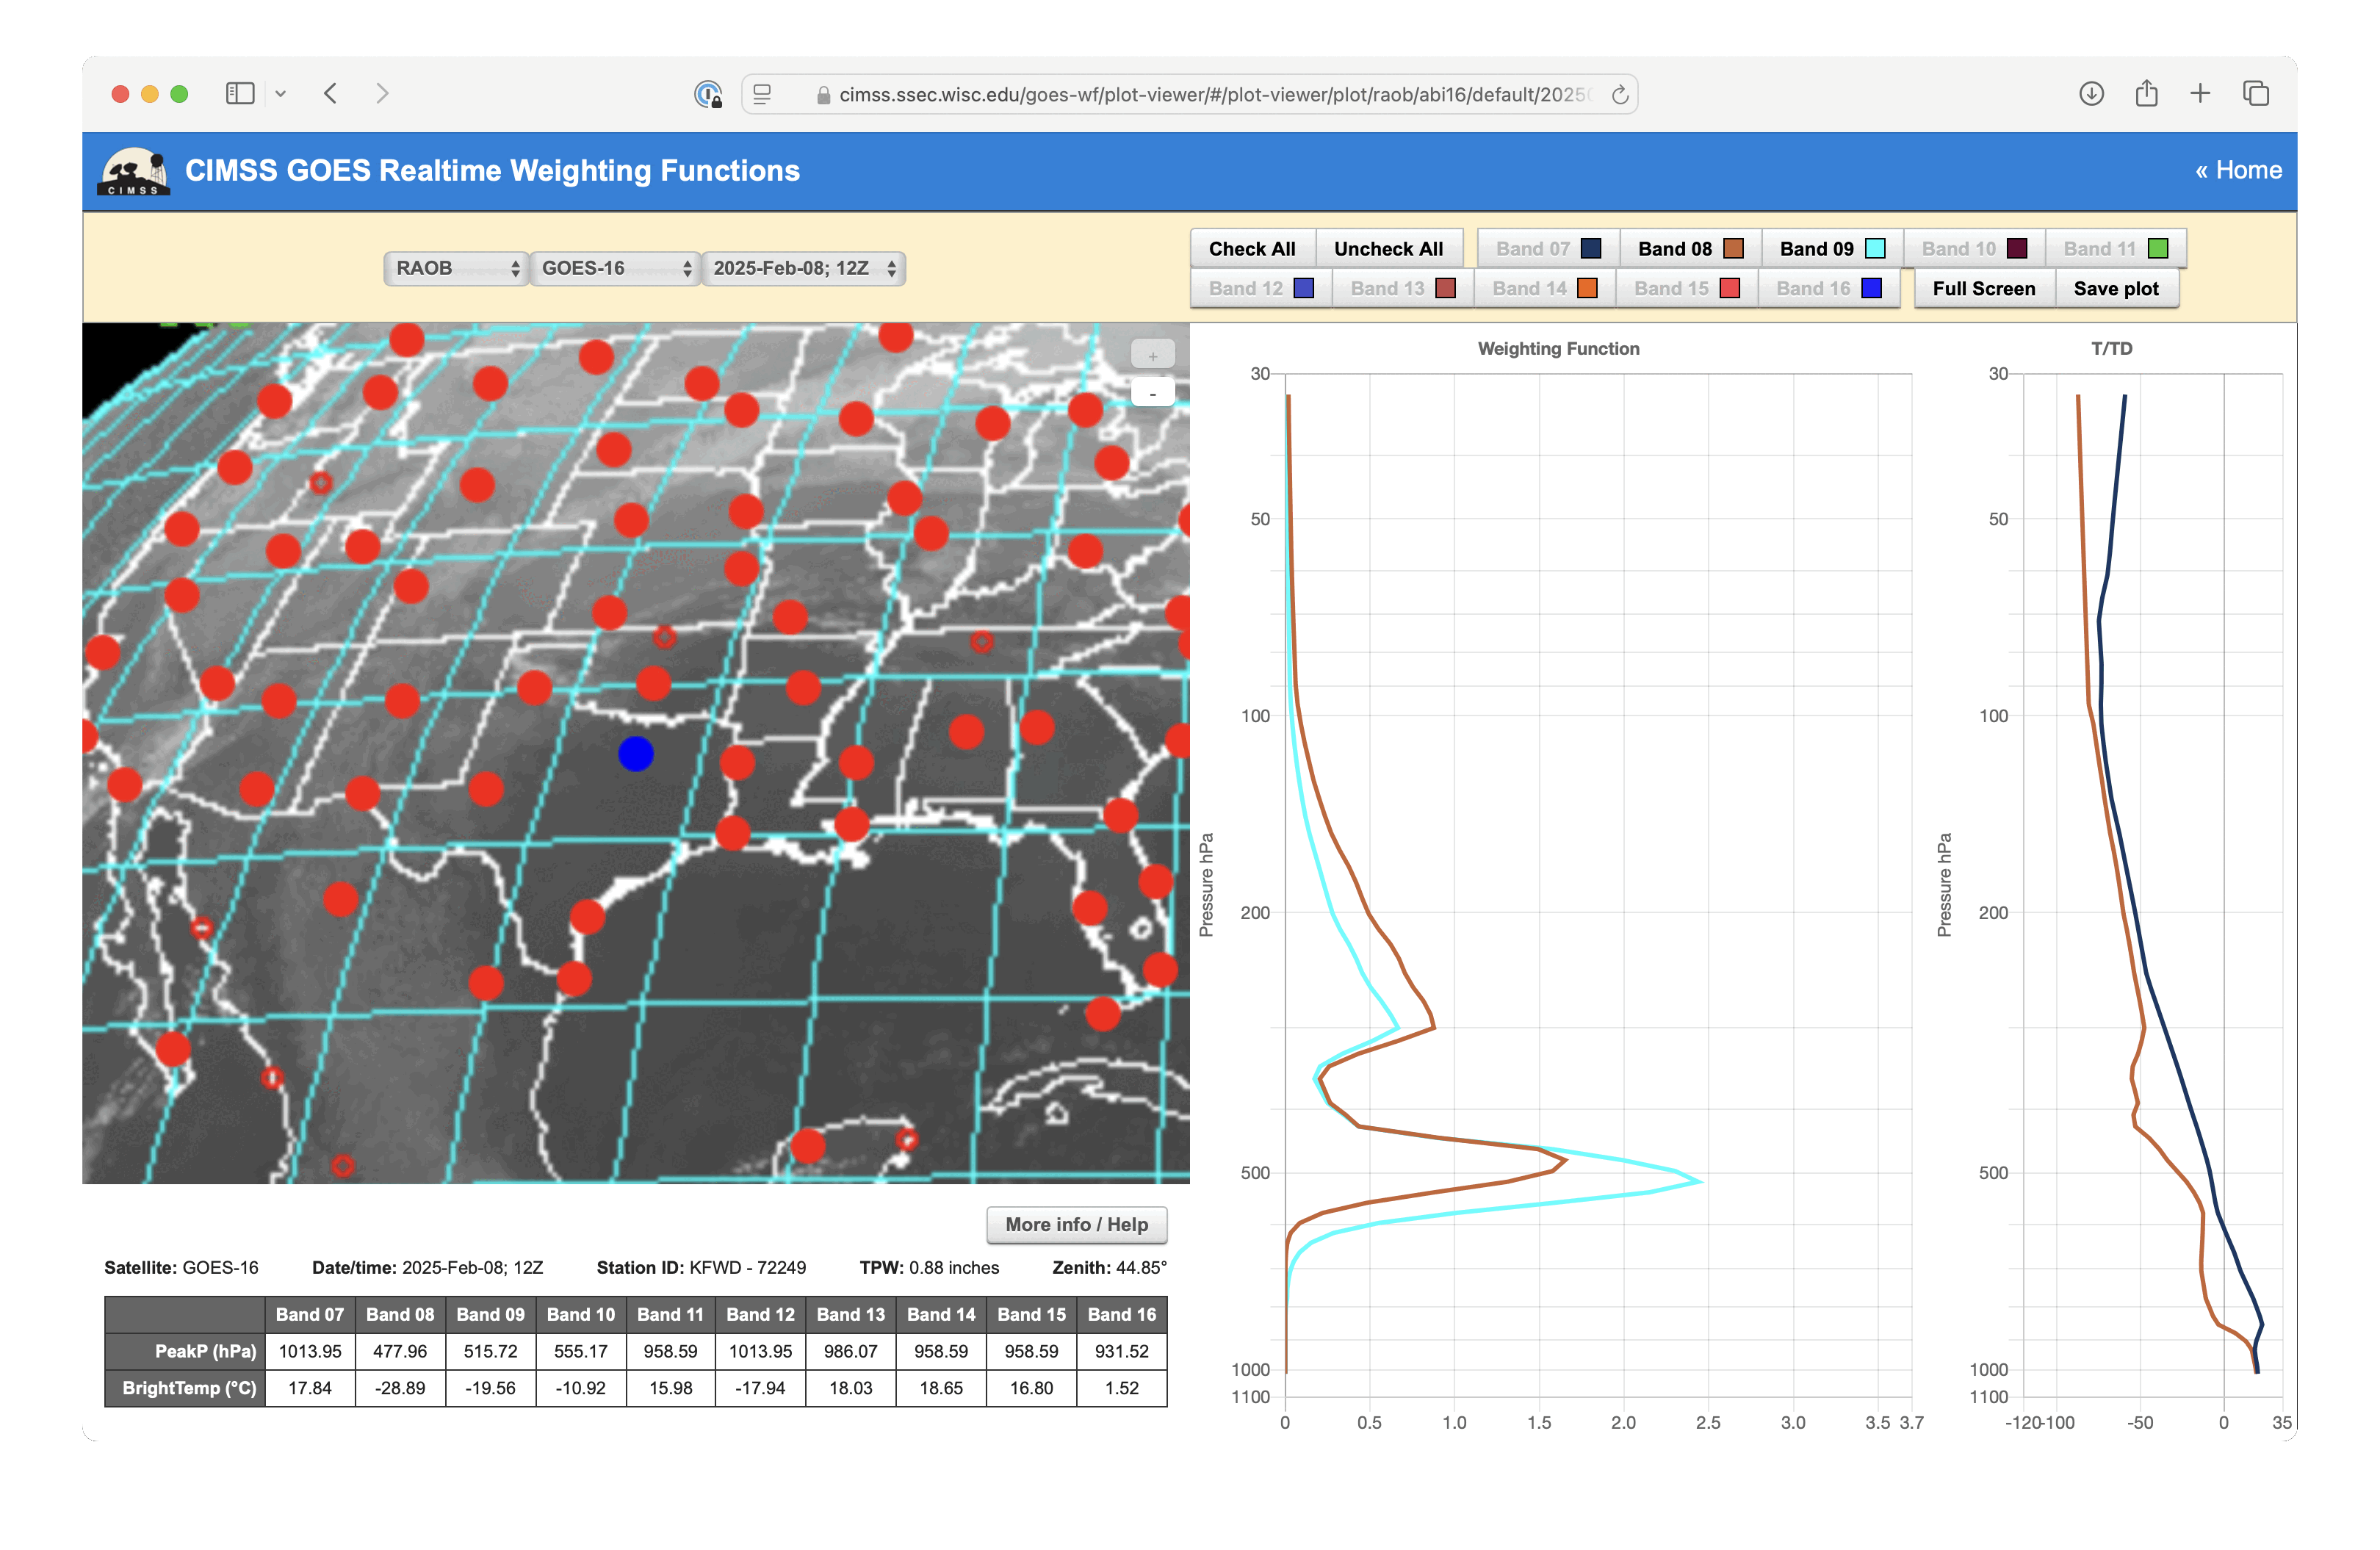
Plots of GOES-16 Water Vapor (6.2 µm / Band 08 and 6.9 µm / Band 09) Weighting Functions, derived using rawinsonde data from Fort Worth TX at 1200 UTC on 8th February and 0000 UTC on 9th February [click to enlarge]
———

GOES-19 Upper-level Water Vapor (6.2 µm) images, with plots of hourly surface wind barbs (red) and gusts (gray/orange/red), from 1401-2331 UTC on 8th February [click to play animated GIF | MP4]

GOES-19 Mid-level Water Vapor (6.9 µm) images, with plots of hourly surface wind barbs (red) and gusts (gray/orange/red), from 1401-2331 UTC on 8th February [click to play animated GIF | MP4]