NGFS Detections of the Hughes Fire in Los Angeles County
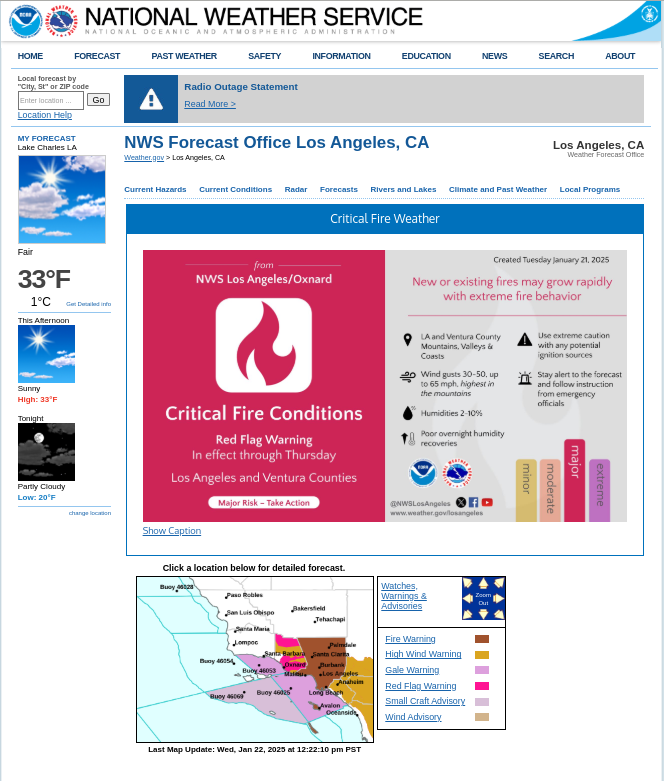
Every-minute true-color imagery from the CSPP Geosphere site (above) shows the quick development of the Hughes Fire in Los Angeles county. This event developed during a time of Red Flag Warnings over Los Angeles and Ventura Counties, as shown in the screenshot image from NWS Los Angeles below.
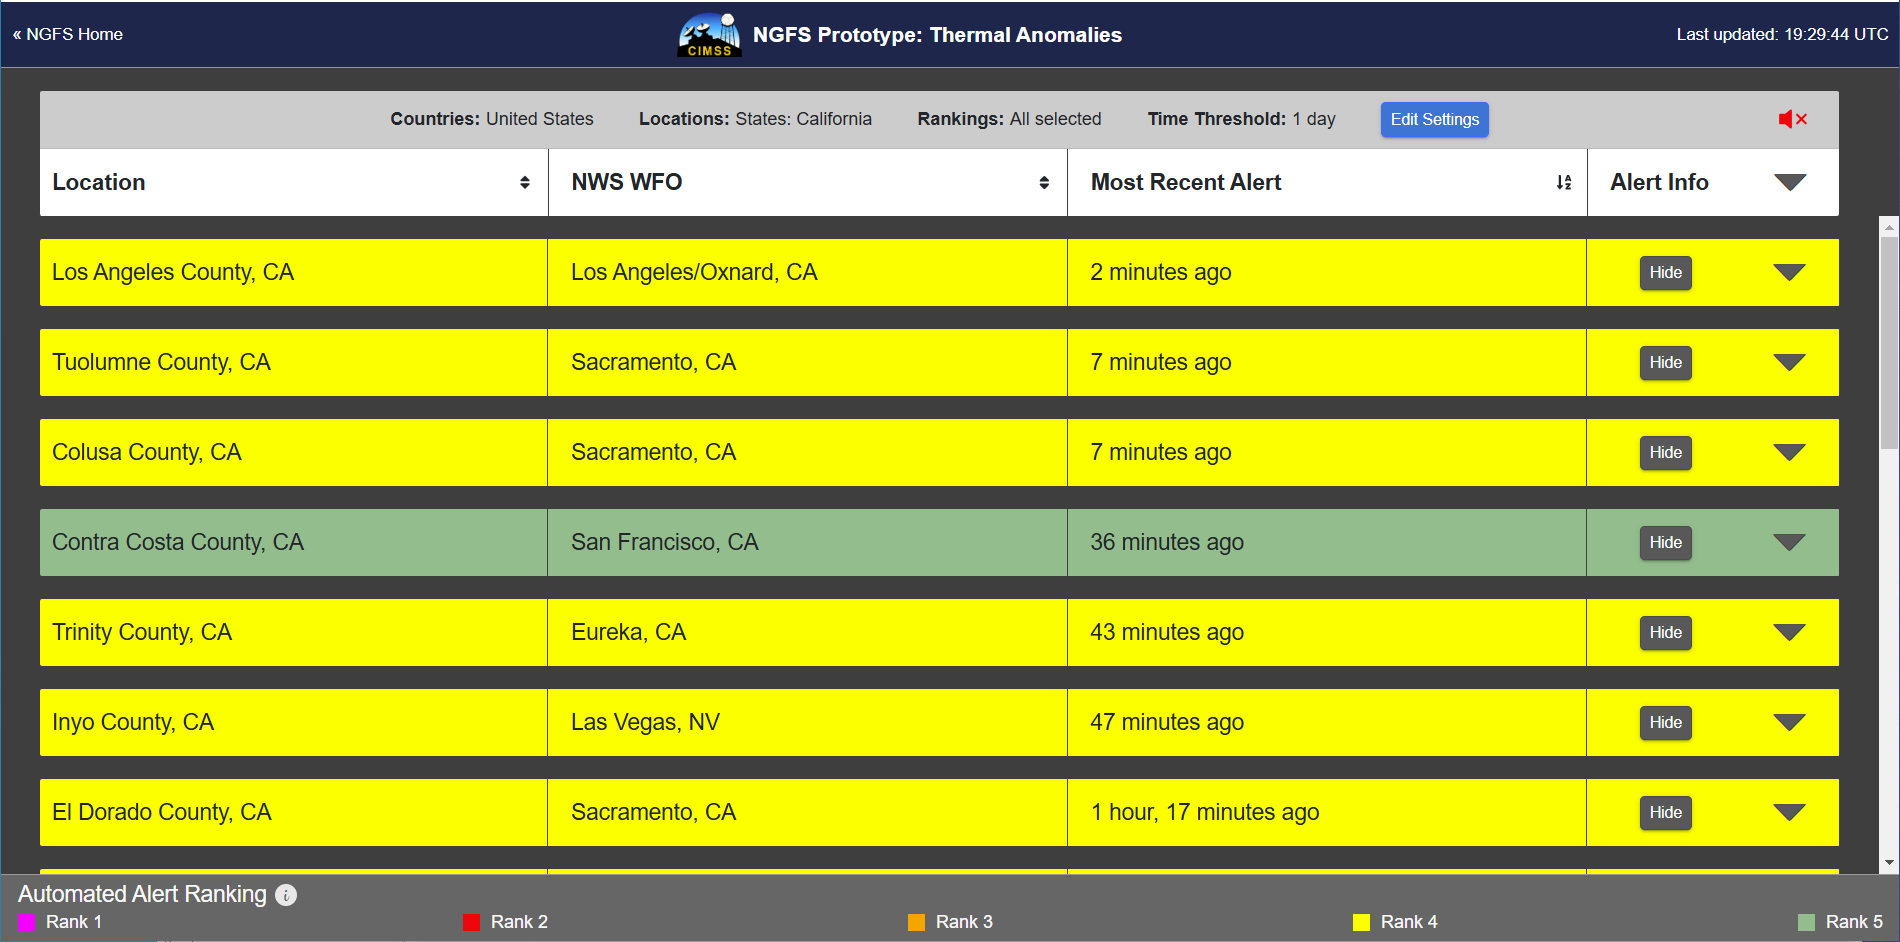
How did NGFS detections do with fire initiation with this event? The Alerts Dashboard that includes a notification of Los Angeles County is shown below. A user would click on the caret at the right edge of the ‘Los Angeles County, CA’ banner at the top to see the county-specific detections.
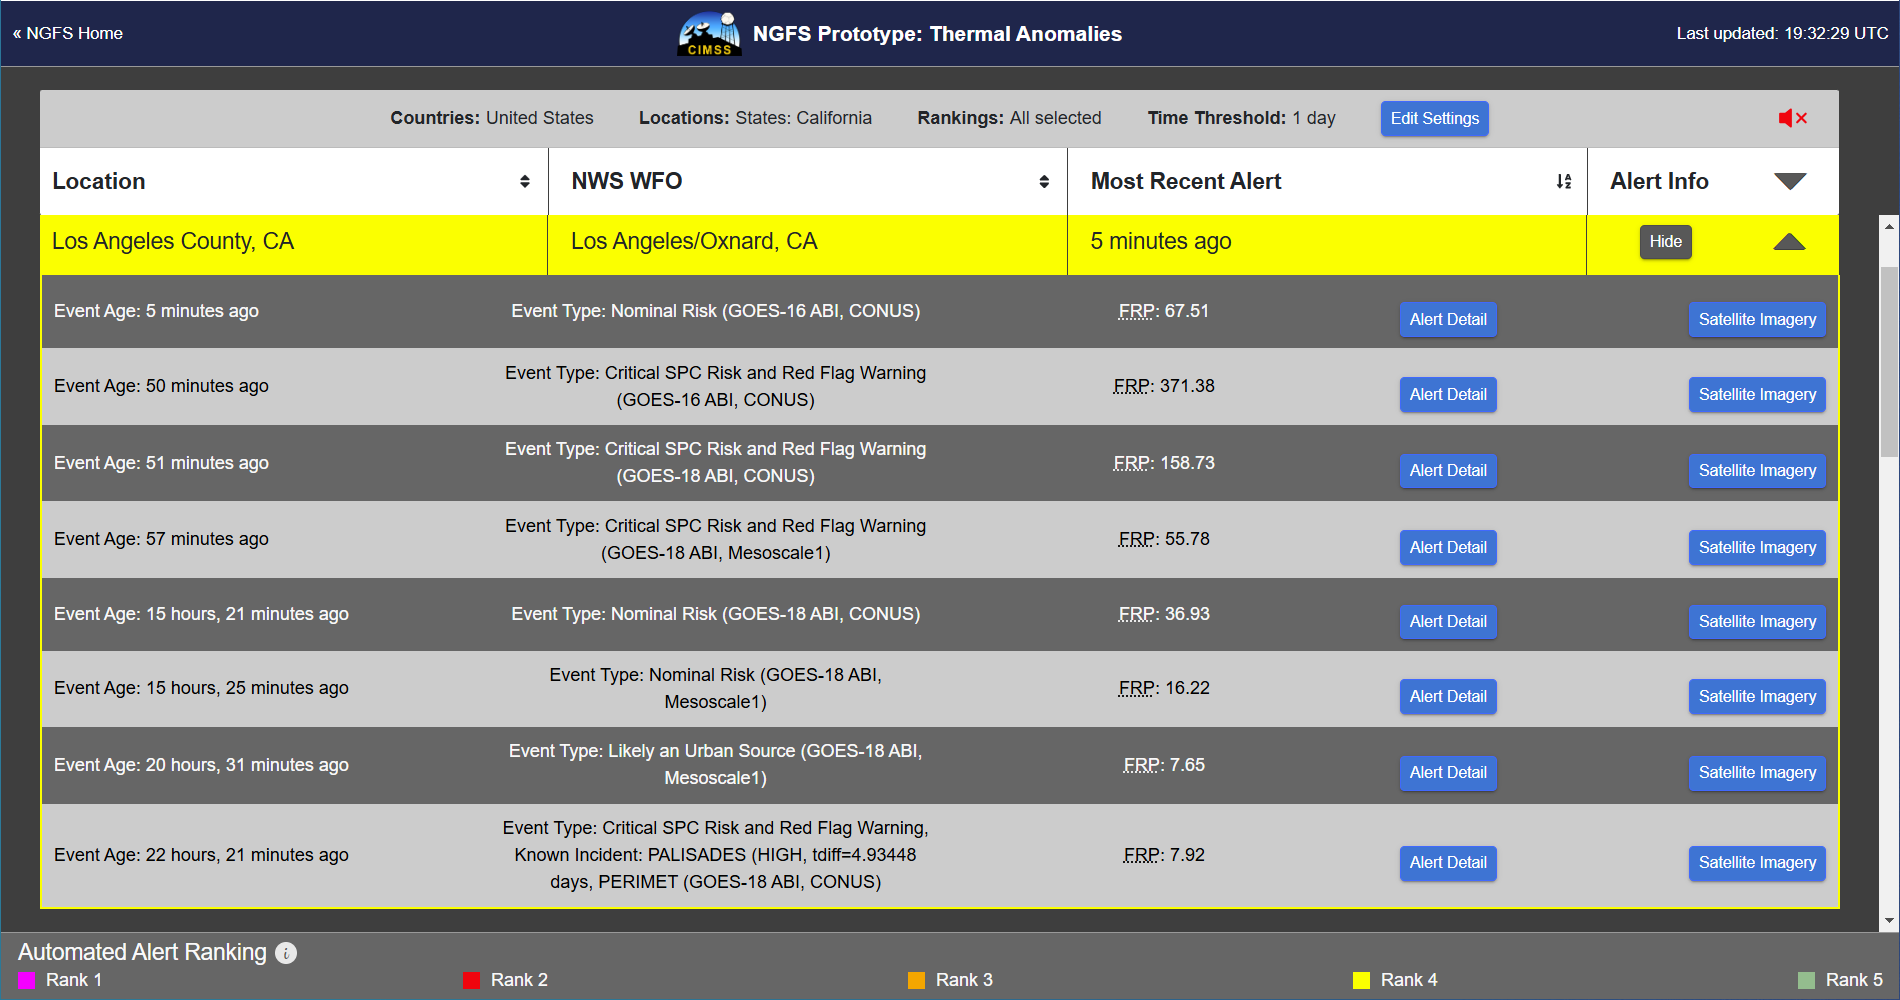
Those detections specific to Los Angeles county are below. Lines 2-4 in the Alerts Dashboard below show the initial detections of a fire 50 minutes ago (GOES-16 CONUS data), 51 minutes ago (GOES-18 CONUS data) and 57 minutes ago (GOES-18 Mesoscale-1 Sector data). The notifications for this fire all show that the development is in a region with Critical Risk from SPC, and a Red Flag Warning from the Los Angeles forecast office1 (see below). It should not surprise you that the more rapid observations from the mesoscale sector leads to earlier detections of the fire!
If you click on the blue ‘Satellite Imagery’ button in the GOES-18 ABI, Mesoscale Sector 1, you’ll see NGFS Microphysics with thermal anomalies outlined. The 1834 UTC image shows the first instance of a probable fire detection. You can probe the imagery as shown (by mousing over) There is a slider on the right-hand side to change the time of the image.
The animation below shows the evolution of the imagery in the five minutes surrounding the initial detection.

AWIPS imagery, above, showing imagery from 1806 to 1845 UTC indicate a rapid development of the fire. The slow animation showing 1833, 1834 and 1835, below, show similar detections as in NGFS; the first detections are at 1834 UTC. Surface observations show very low dewpoints over southern California, and that dryness will affect the growth of the fire.

The imagery below (NGFS Microphysics, FIre Temperature RGB, GeoColor and the Basemap image) from 2034 UTC — just two hours after initiation, show a large, hot fire with a smoke plume.

Here is the WatchDuty page on this fire. The first entry on this fire is at 1842 UTC.
1Note: Typically a Red Flag Warning will cause a magenta banner. For this case, parts of Los Angeles county — a county with a large area — were not in a Red Flag Warning. The most recent detection in Los Angeles County is not in the part of that county that has a Red Flag Warning (note how the alert shown above does identify that more recent risk as ‘Nominal’); that is controlling the coloring of the county banner. CIMSS Scientists are working on a fix to this so that Los Angeles County will retain its Magenta Banner even if a fire develops in a part of the county where Red Flag warnings are not present.

1-minute GOES-18 Shortwave Infrared (3.9 µm) images (left) and Red Visible (0.64 µm) images + Fire Mask derived product (right), with 15-minute METAR surface reports plotted in yellow and 15-minute RAWS reports plotted in violet, from 1832-1834 UTC on 22nd January; Interstate highways are plotted in red (courtesy Scott Bachmeier, CIMSS) [click to enlarge]
Regarding the initiation time of the Hughes Fire, by using a color enhancement that is well-suited for fire detection, it can be seen that an unambiguous increase in 3.9 µm infrared brightness temperature (darker green pixels) occurred at 1833 UTC near the northeast tip of Castaic Lake (above). Then at 1834 UTC the Fire Mask derived product displayed a “High Probability Fire” pixel (orange).
A 7-hour animation of 1-minute GOES-18 Shortwave Infrared and Visible + Fire Mask (below) showed the rapid increase in areal coverage and intensity of the Hughes Fire — the fire exhibited a peak 3.9 µm infrared brightness temperature of 137.88ºC from 1855-2014 UTC. Wind gusts at a RAWS site just north of the fire perimeter (WMSC1, Hughes Lake) reached 45 mph at 2300 UTC, a factor that aided rapid fire growth. As the southwest flank of the fire approached Interstate 5, a section of I-5 was closed. In addition, smoke from the fire reduced surface visibility to 4 miles near the coast at Naval Air Station Point Mugu (KNTD). By sunset, a marked decrease in the fire’s thermal signature was evident.
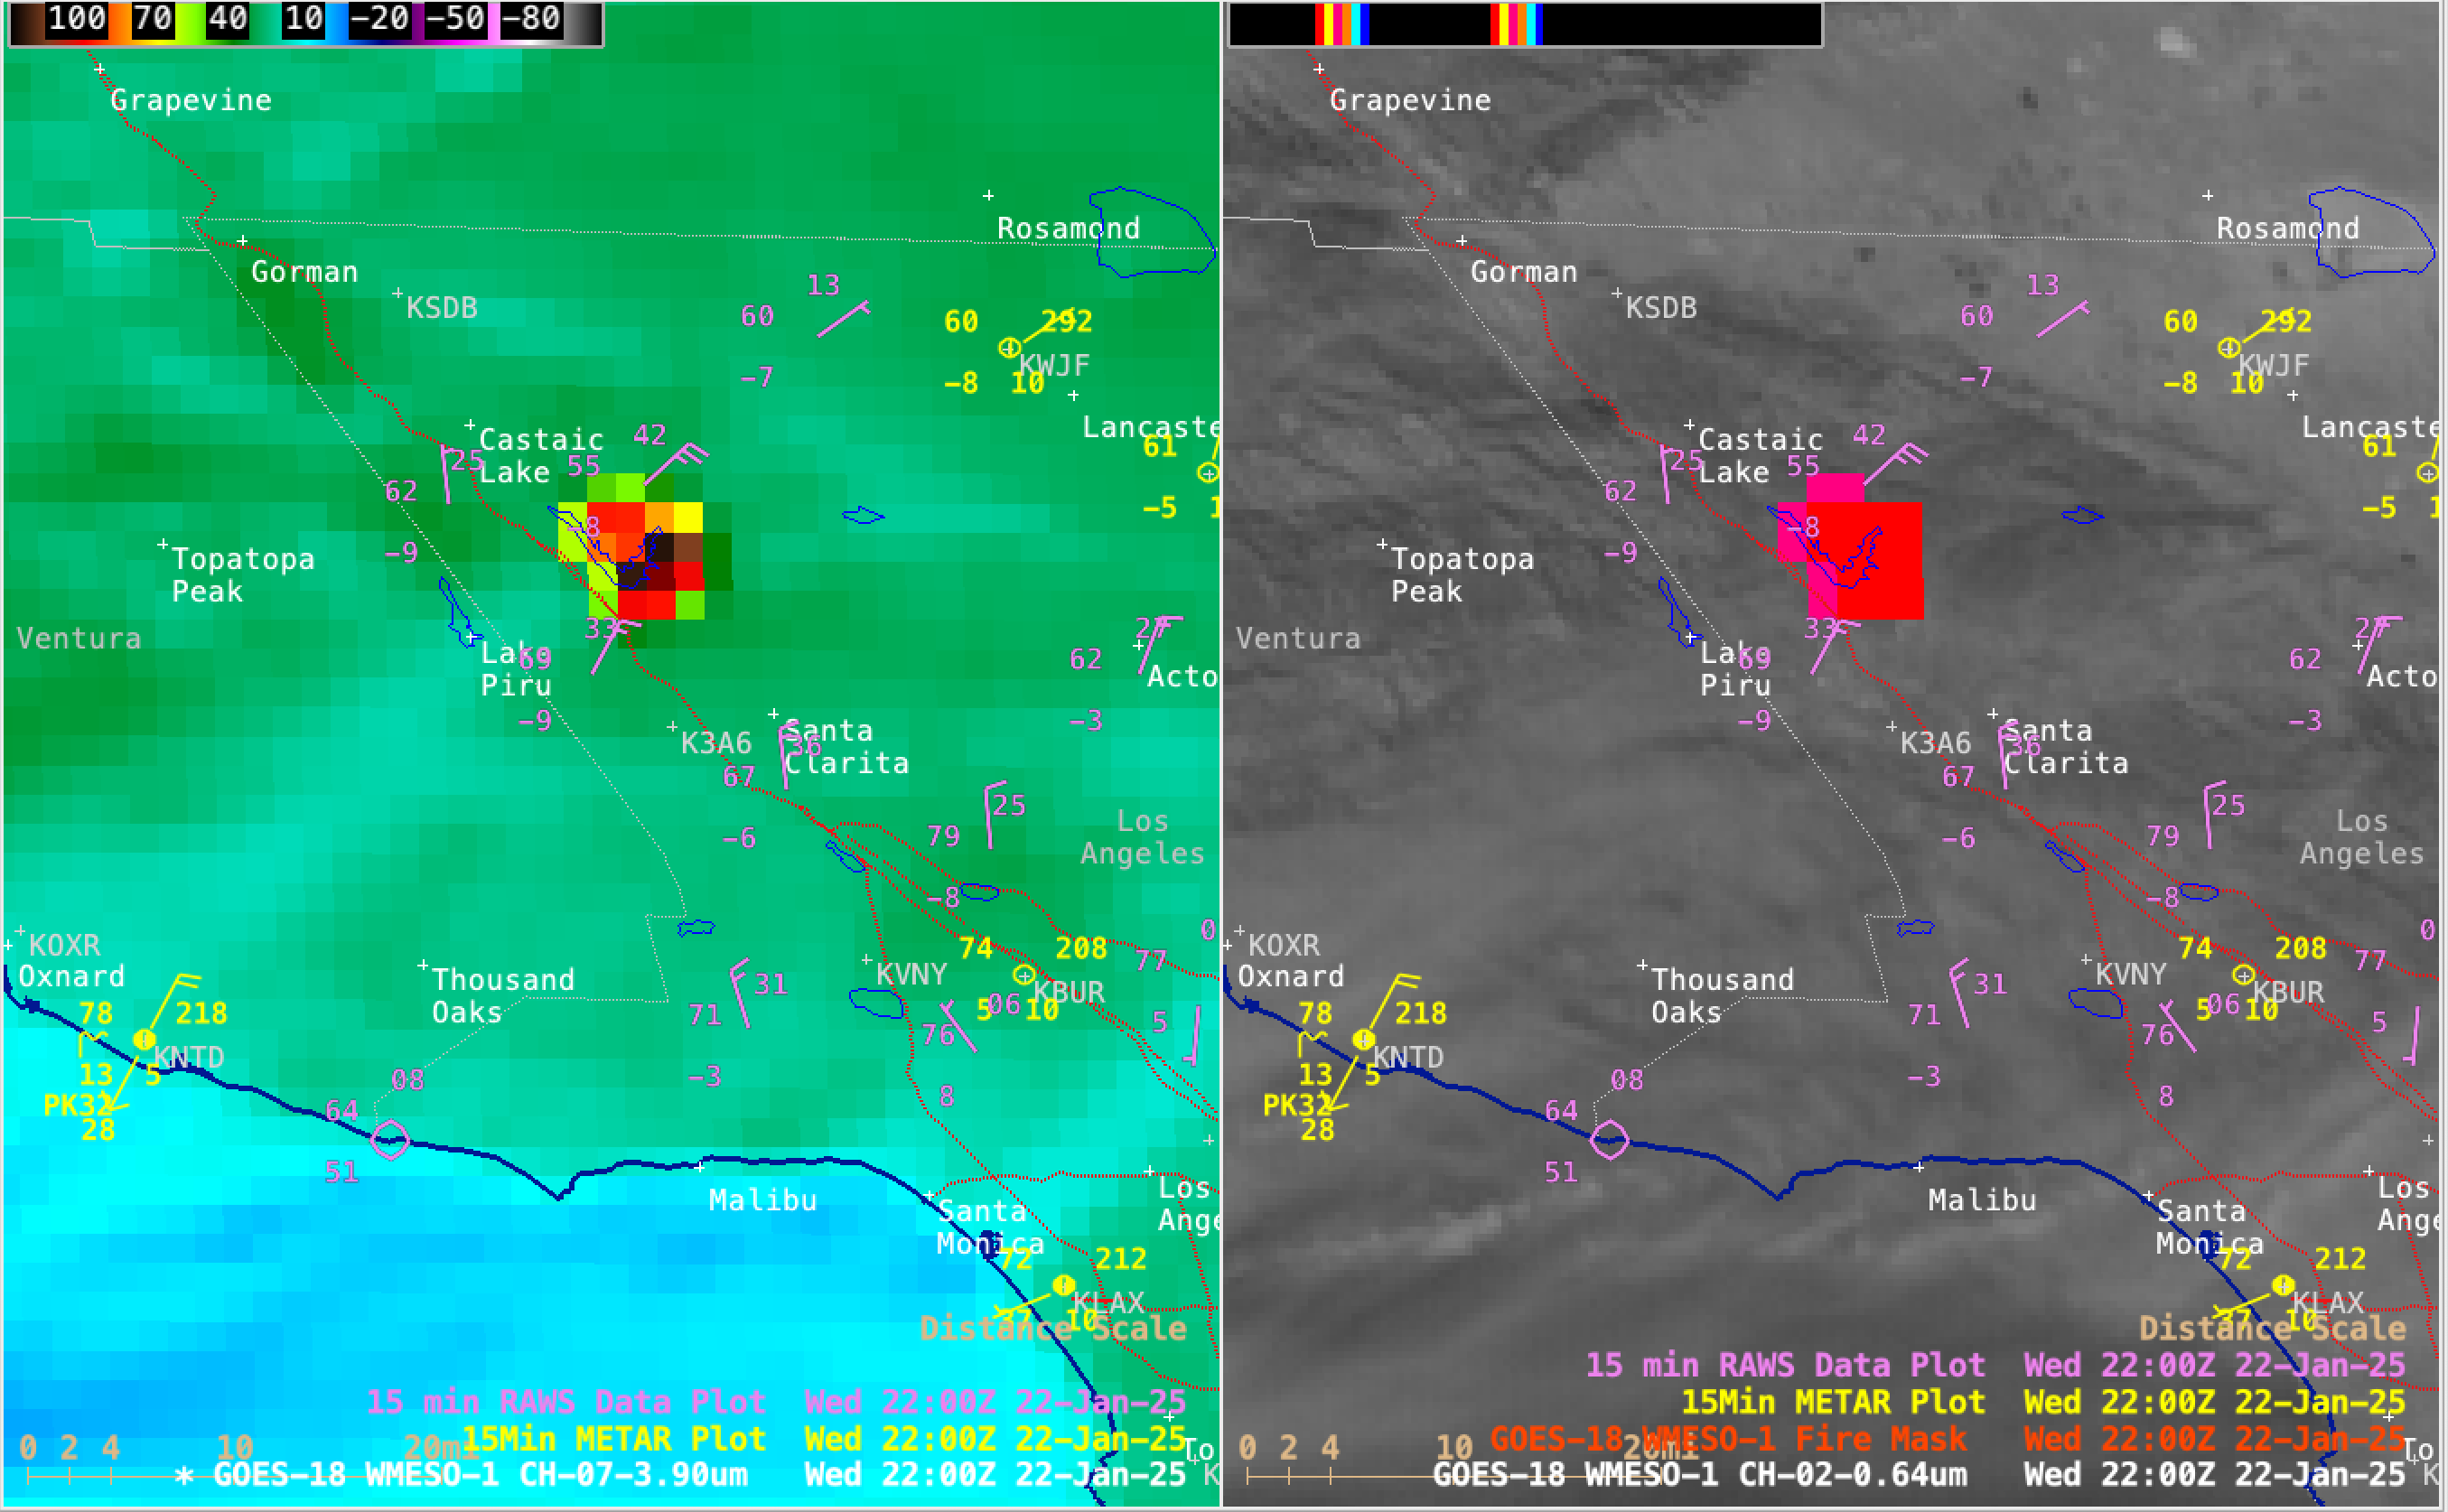
1-minute GOES-18 Shortwave Infrared (3.9 µm) images (left) and Red Visible (0.64 µm) images + Fire Mask derived product (right), with 15-minute METAR surface reports plotted in yellow and 15-minute RAWS reports plotted in violet, from 1801 UTC on 22nd January to 0100 UTC on 23rd January; Interstate highways are plotted in red (courtesy Scott Bachmeier, CIMSS) [click to play MP4 animation]