Supercell thunderstorm produces giant hail and 100 mph winds in South Dakota
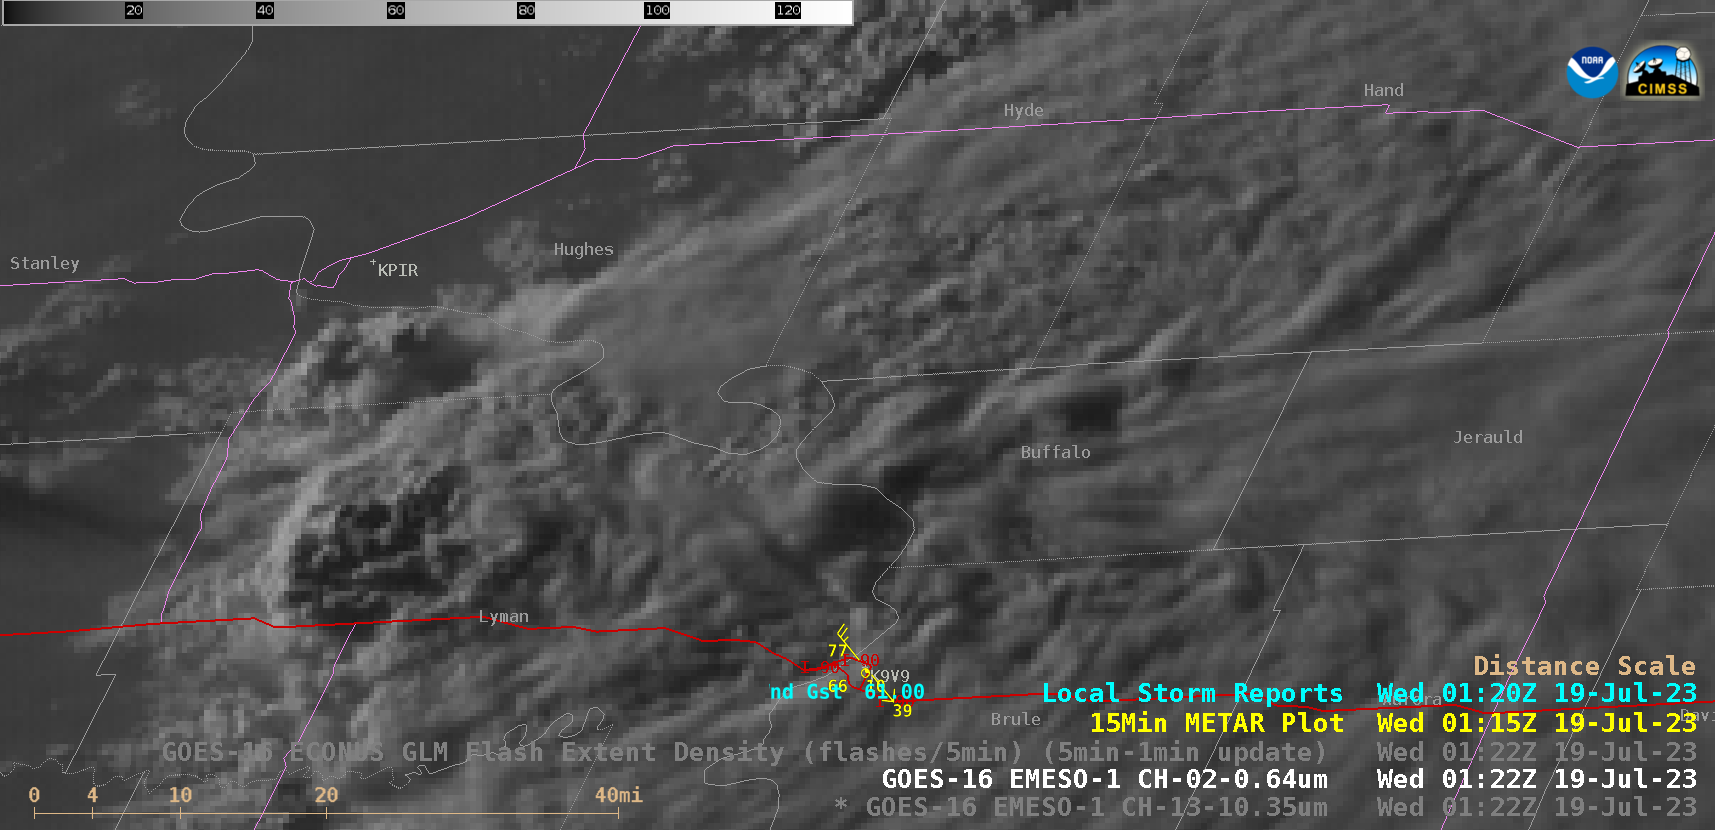
GOES-16 “Red” Visible (0.64 µm) images, with plots of Local Storm Reports (cyan), 15-minute METAR surface reports (yellow), Interstate Highways (red) and State Highways (violet) [click to play animated GIF | MP4]
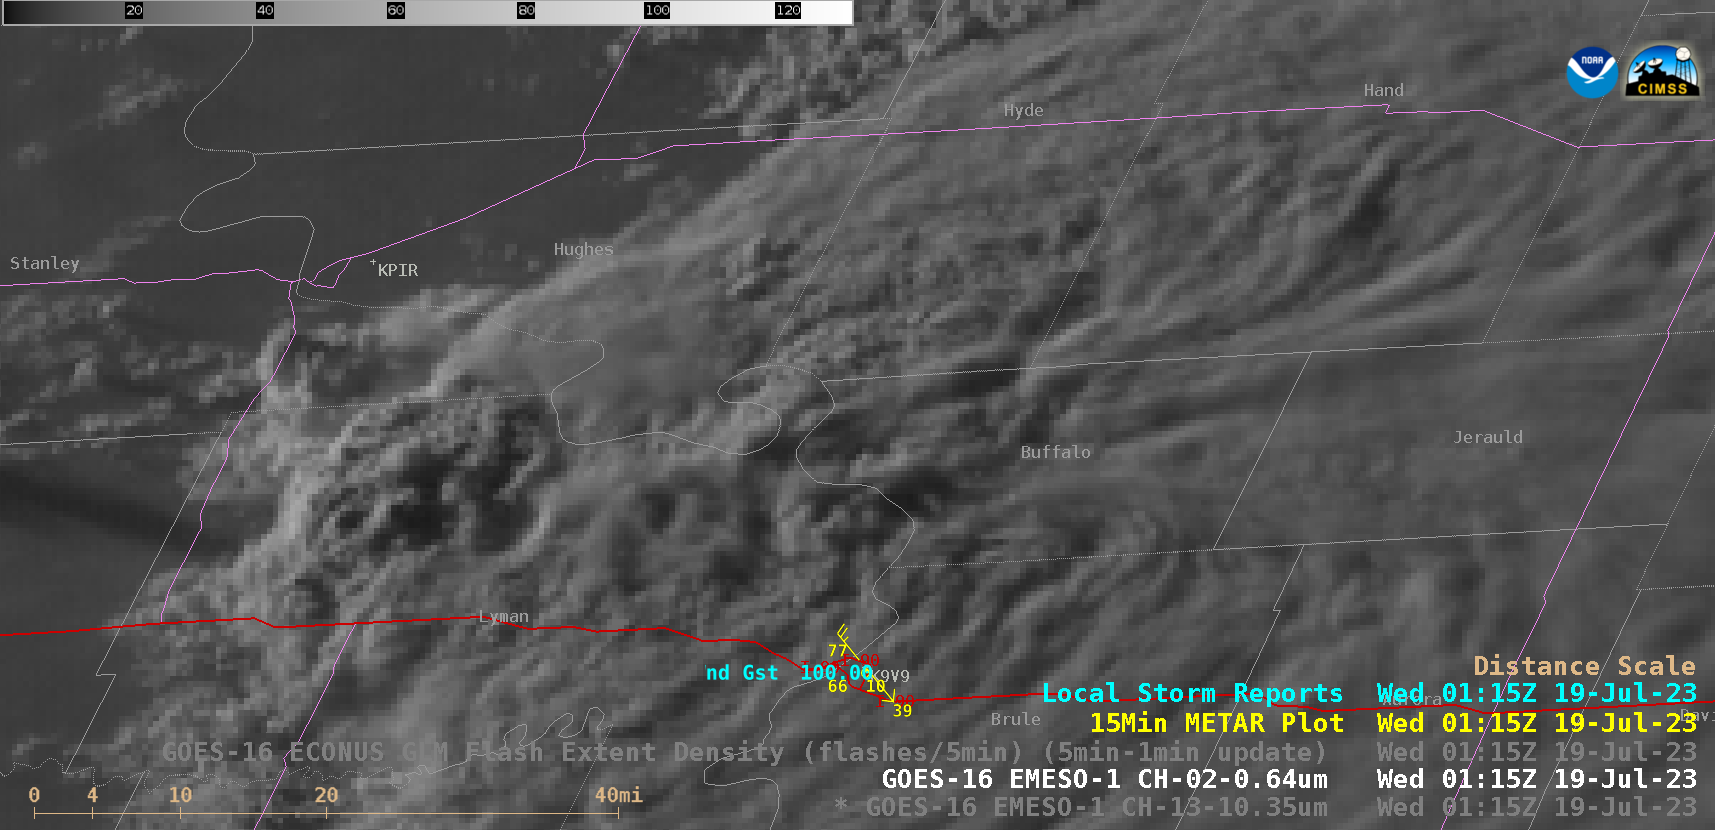
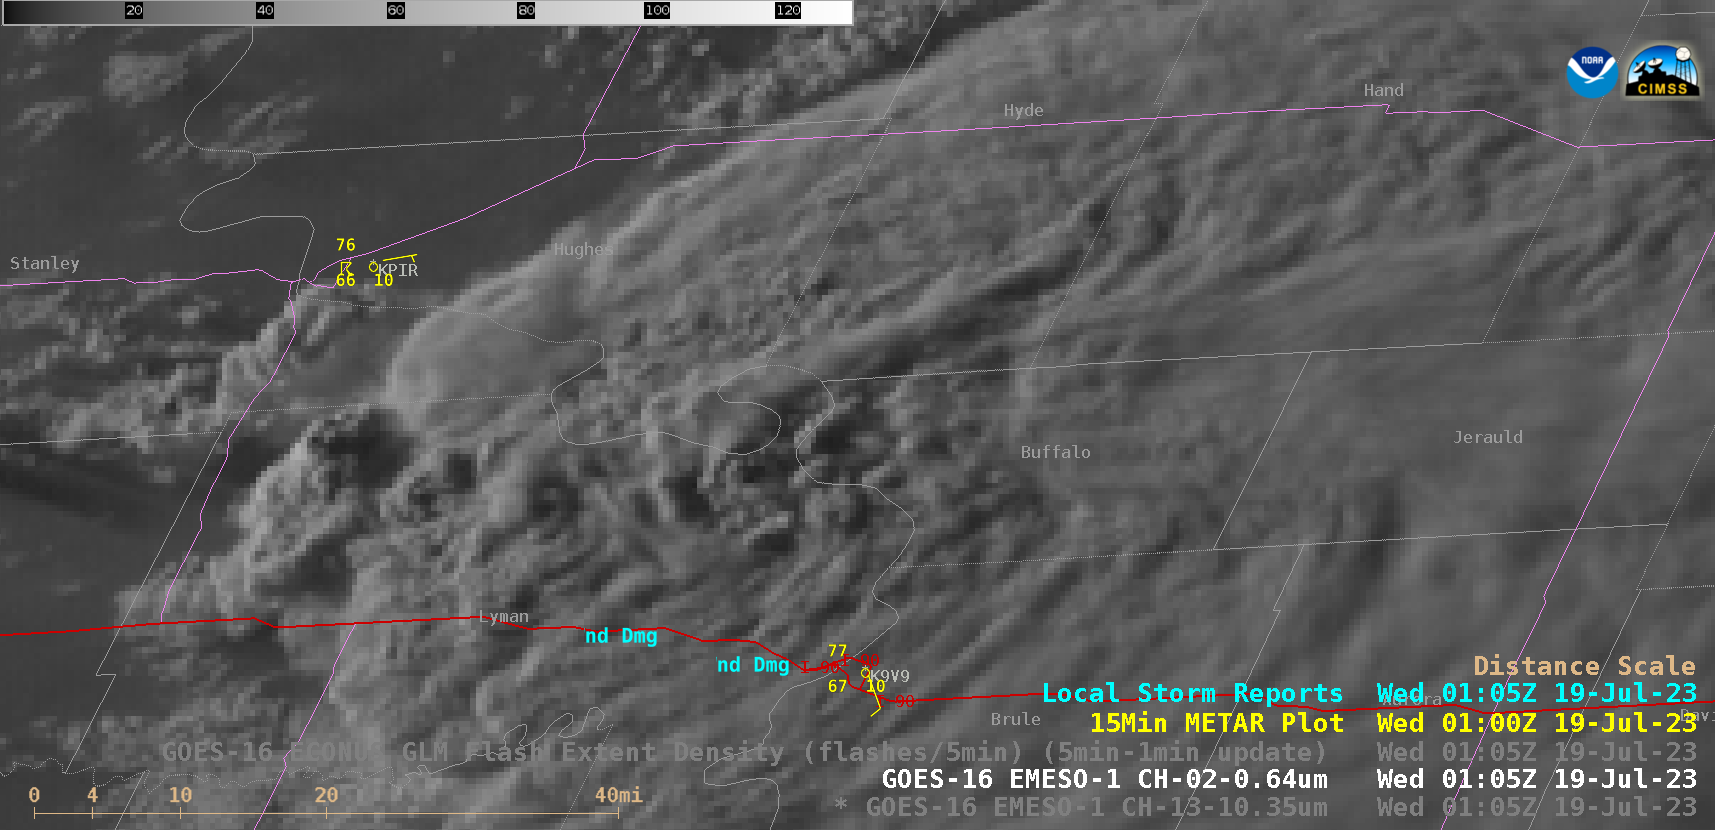
In the corresponding 1-minute GOES-16 “Clean” Infrared Window (10.3 µm) images (below), the coldest thunderstorm overshooting tops exhibited infrared brightness temperatures around -70ºC (brighter white pixels embedded within dark black regions).
GOES-16 “Clean” Infrared Window (10.3 µm) images, with plots of Local Storm Reports (cyan), 15-minute METAR surface reports (yellow), Interstate Highways (red) and State Highways (violet) [click to play animated GIF | MP4]
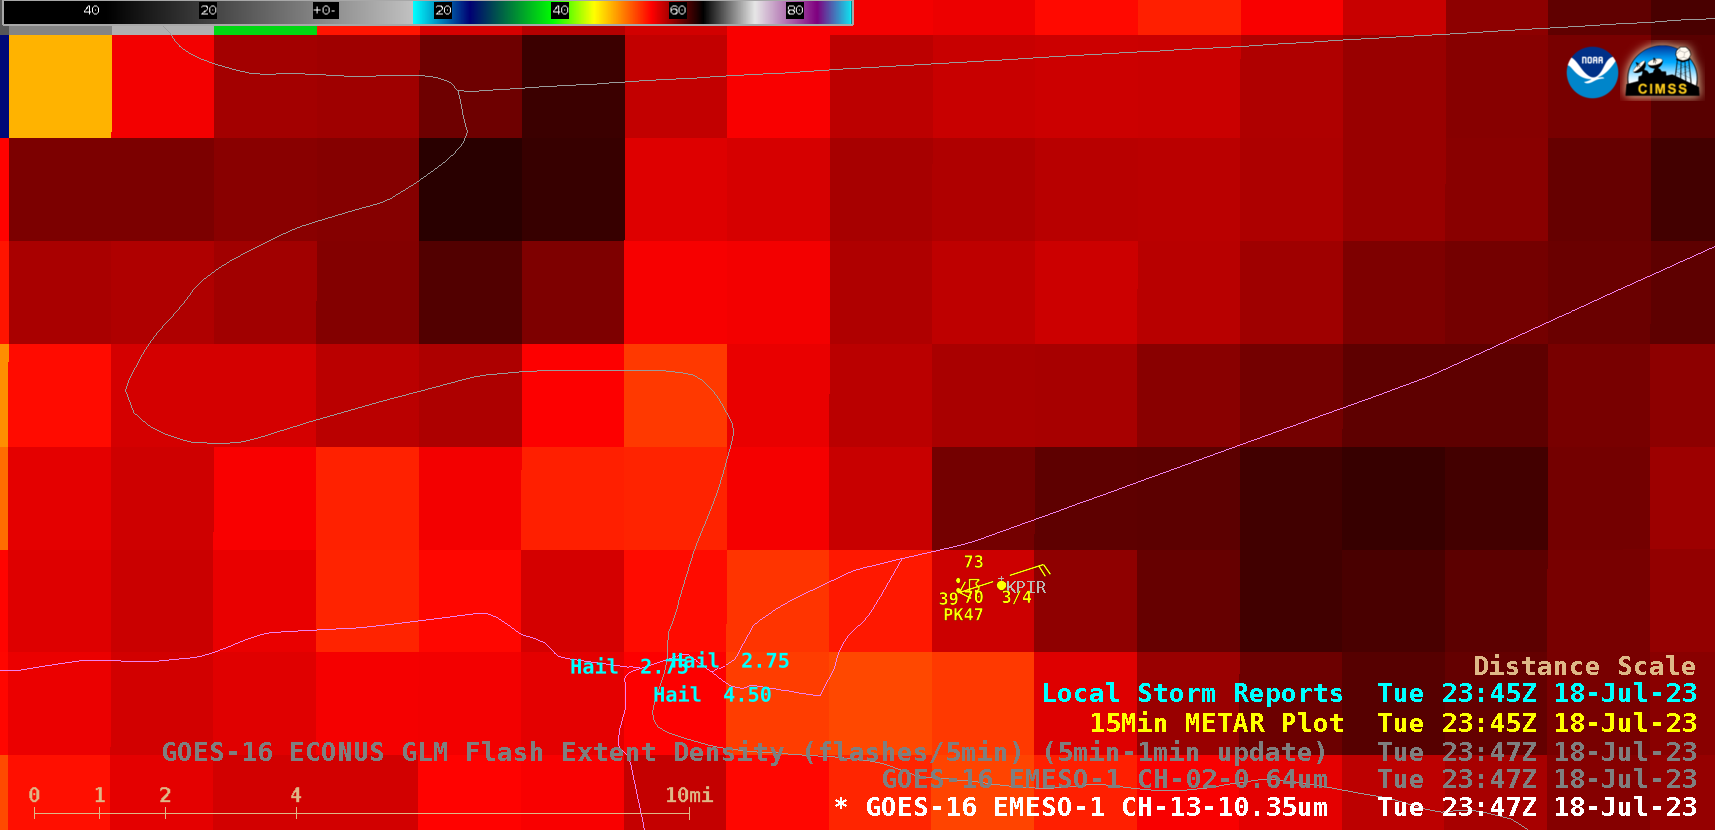
GOES-16 “Clean” Infrared Window (10.3 µm) image at 2347 UTC, with Local Storm Reports plotted in cyan [click to enlarge]
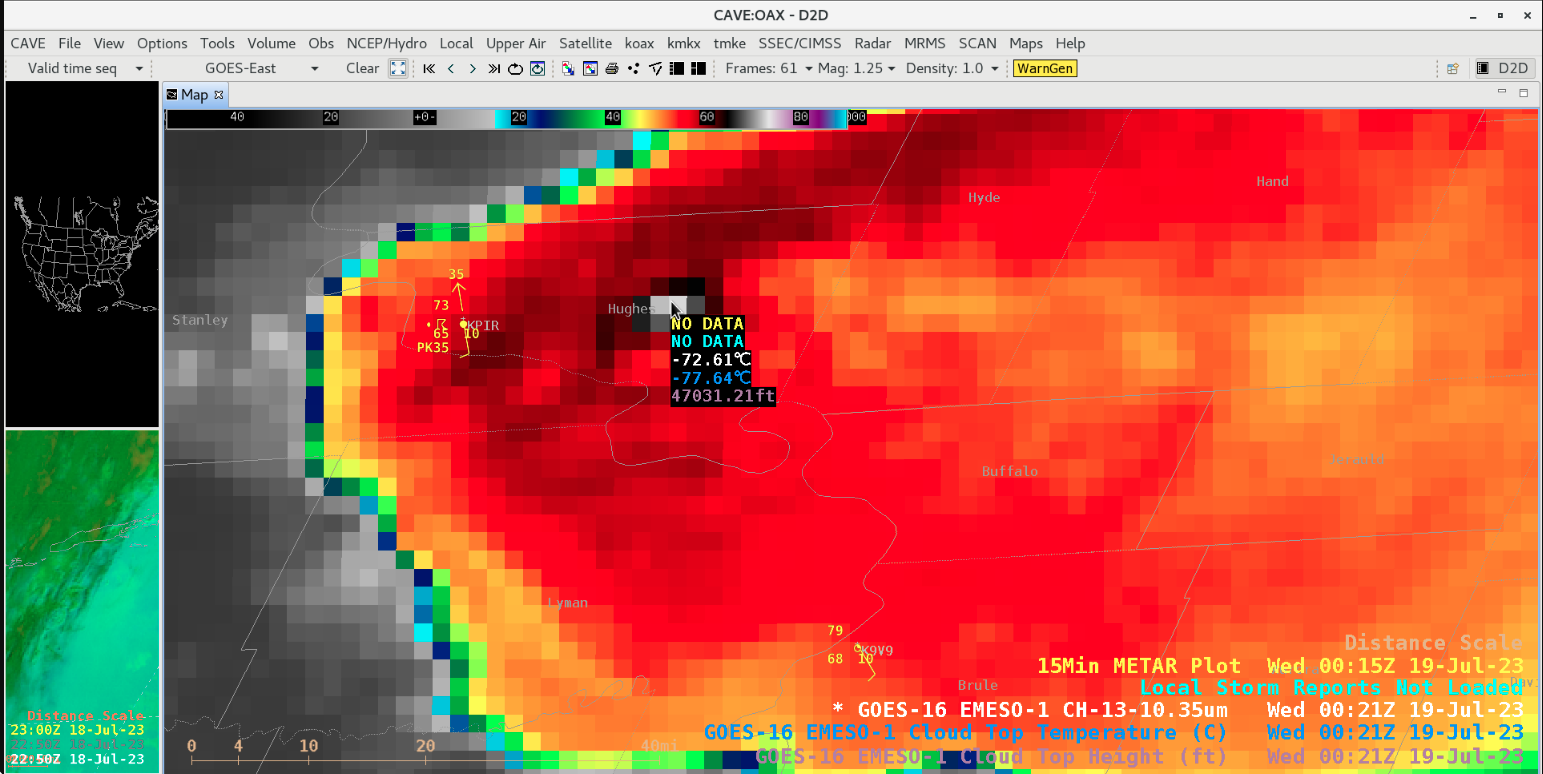
Cursor sample of GOES-16 infrared (10.3 µm) brightness temperature, Cloud Top Temperature and Cloud Top Height derived products at 0021 UTC [click to enlarge]
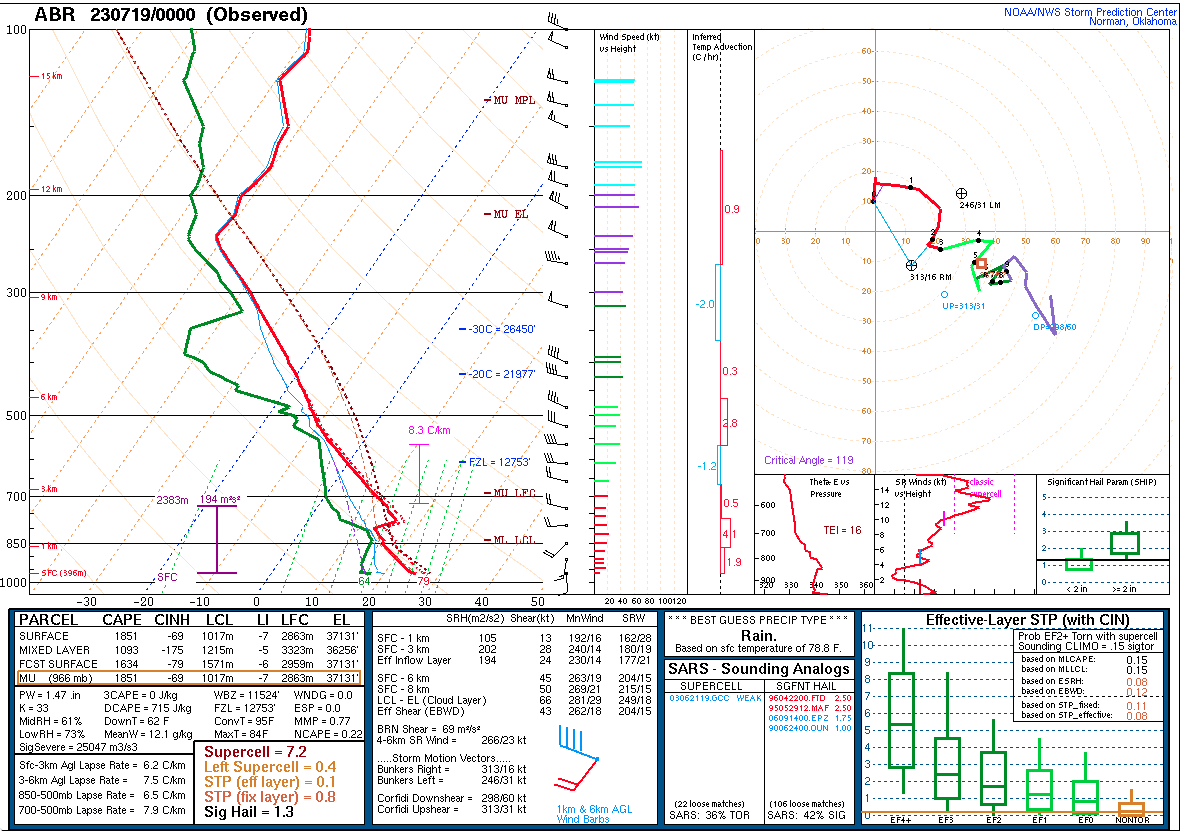
Plot of rawinsonde data from Aberdeen SD at 0000 UTC [click to enlarge]
GOES-16 “Red” Visible (0.64 µm) images, with an overlay of GLM Flash Extent Density [click to play animated GIF | MP4]
GOES-16 Infrared (top) and Visible (bottom) images, with Local Storm Reports potted in cyan [click to play animated GIF | MP4]
GOES-16 Visible images with an overlay of the CAPE derived product [click to play animated GIF | MP4]
GOES-16 Visible images with an overlay of the Lifted Index derived product [click to play animated GIF | MP4]
GOES-16 Visible images with an overlay of the Total Precipitable Water derived product [click to play animated GIF | MP4]