Severe thunderstorms across Iowa and llinois

GOES-16 Visible/Infrared Sandwich RGB images, with Local Storm Reports plotted in cyan [click to play animated GIF | MP4]
1-minute GOES-16 Visible/Infrared Sandwich RGB images with an overlay of GLM Flash Extent Density (below) revealed several lightning jumps as the storms moved eastward during that time period.

GOES-16 Visible/Infrared Sandwich RGB images with an overlay of GLM Flash Extent Density (and Local Storm Reports plotted in cyan) [click to play animated GIF | MP4]
GOES-16 “Clean” Infrared Window (10.3 µm) and “Red” Visible (0.64 µm) images at 1727 UTC [click to enlarge]
According to a plot (source) of 1800 UTC rawinsonde data from Quad Cities, Iowa (below), the -71ºC infrared brightness temperature corresponded to a Most Unstable (MU) air parcel overshoot of about 1 km from its 200 hPa Equilibrium Level (EL), while the -60ºC AACP infrared brightness temperature was close to those seen in the stratospheric portion of the sounding.
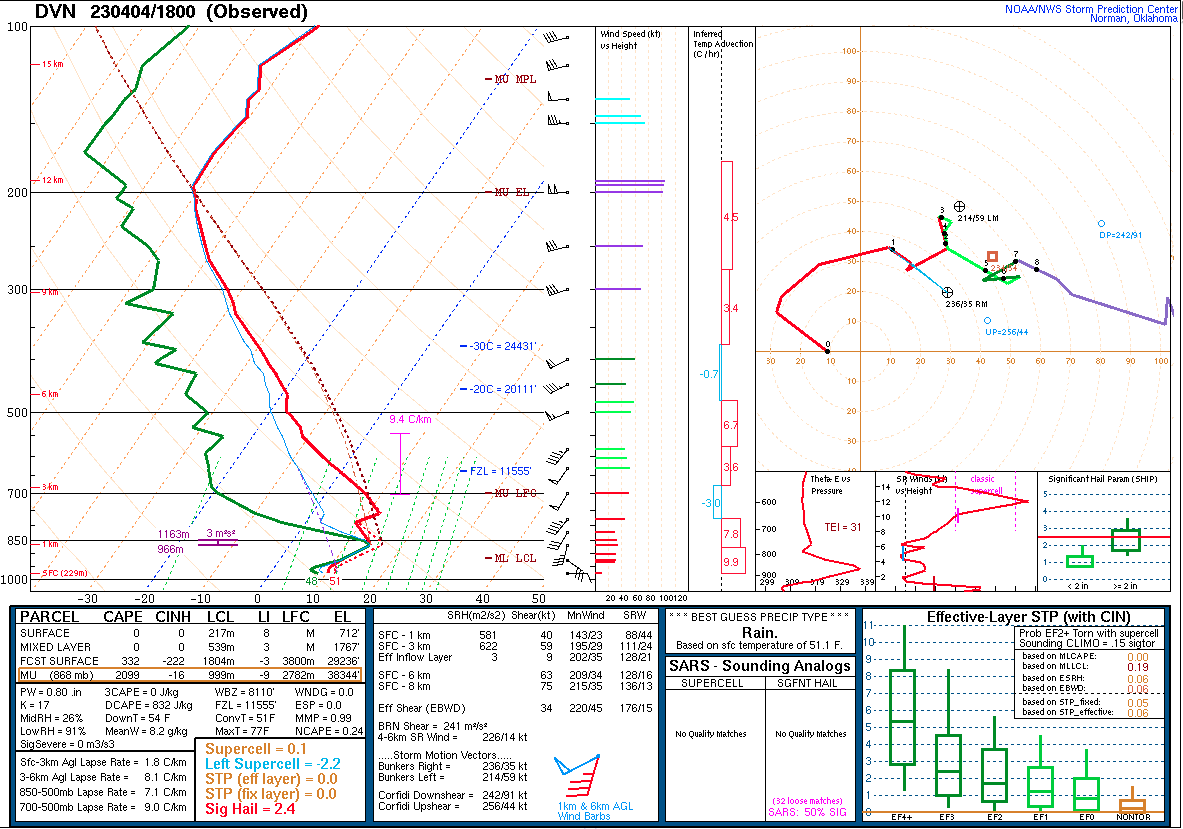
Plot of 1800 UTC rawinsonde data from Quad Cites, Iowa [click to enlarge]