Lake effect snow downwind of Lake Erie
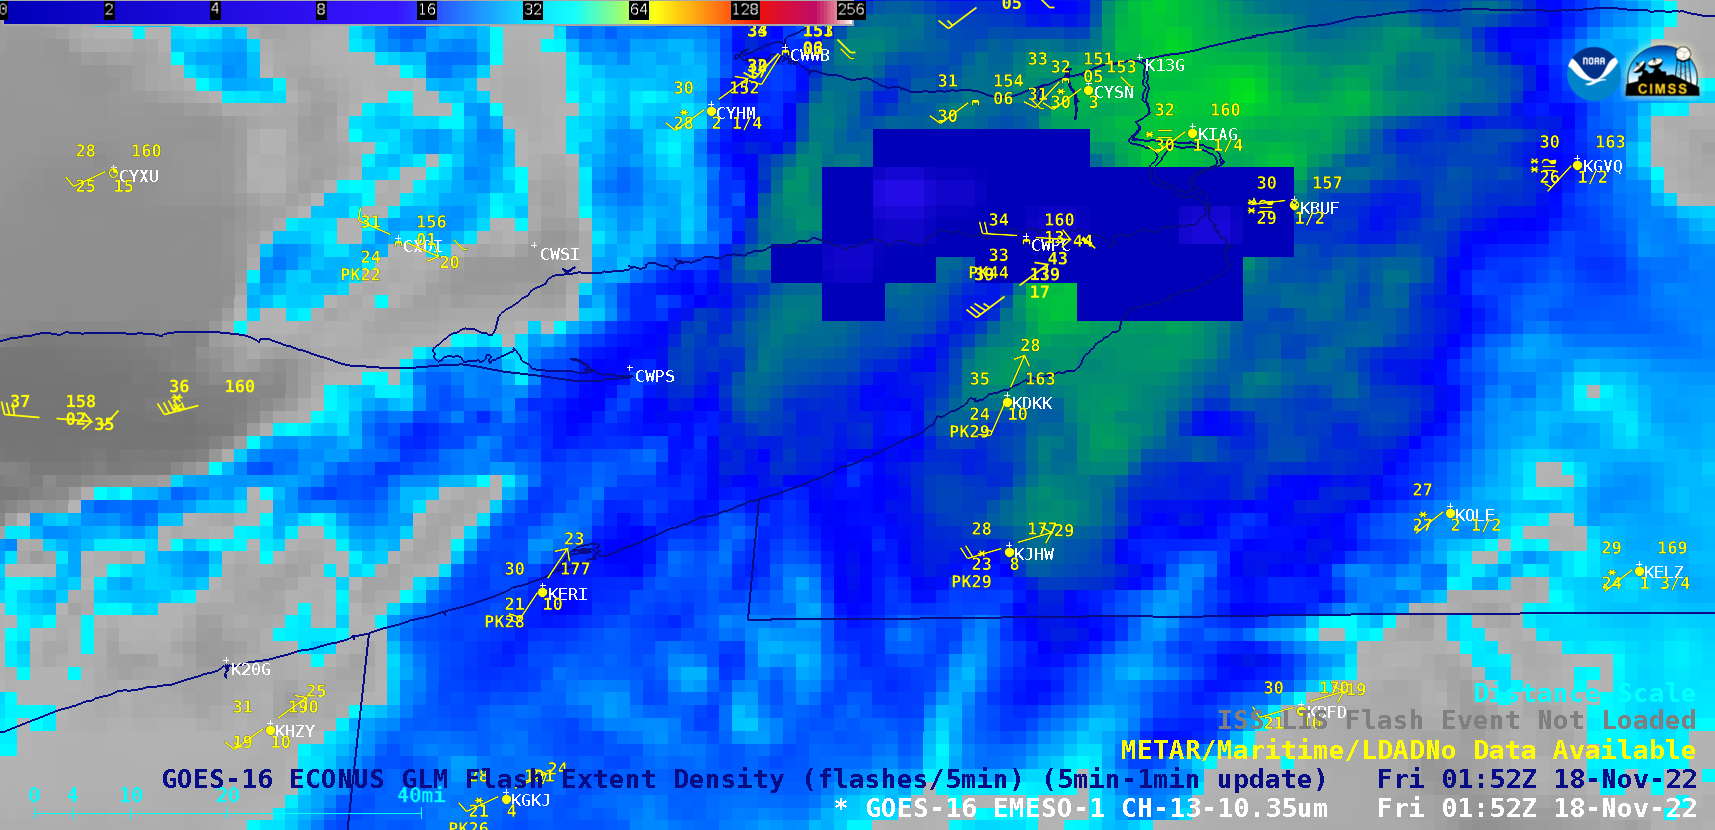
GOES-16 “Clean” Infrared Window (10.3 µm) images, with an overlay of GLM Flash Extent Density [click to play MP4 animation]
In the wake of this initial impulse, a dominant LES band became established along the axis of Lake Erie, which persistent during the entire night and into the following morning — snowfall accumulations were as high as 36.0 inches by 1530 UTC (10:30 AM EST).
After sunrise on 18 November, 1-minute GOES-16 Day Cloud Phase Distinction RGB images (below) indicated that much of the dominant LES band had cloud tops of mixed phase (supercooled water droplet + ice crystal) or glaciated phase (shades of yellow to green). By 2100 UTC (4:00 PM EST) on 18 November, the highest snowfall accumulations had reached 54 inches at Orchard Park just south of Buffalo.

GOES-16 Day Cloud Phase Distinction RGB images, with an overlay of GLM Flash Extent Density [click to play animated GIF | MP4]
Suomi-NPP VIIRS True Color RGB and False Color RGB images, valid at 1828 UTC [click to enlarge]
GOES-16 Cloud Top Phase derived product [click to play animated GIF | MP4]
GOES-16 “Clean” Infrared Window (10.3 µm) images, with an overlay of GLM Flash Extent Density [click to play animated GIF | MP4]
===== 19 November Update =====

GOES-16 Day Snow-Fog RGB and Day Cloud Phase Distinction RGB images [click to play animated GIF | MP4]
=====
A list of storm total snowfall amounts from this multi-day (16-20 November) LES event is available here.