Hurricane Force low in the southern Bering Sea

GOES-18 Air Mass RGB images, with plots of hourly surface reports [click to play animated GIF | MP4]
The orange-to-red hues seen in the Air Mass RGB imagery indicated the presence of dry, ozone-rich stratospheric air within the upper portion of the atmospheric column (due to a lowering tropopause) — and AK-NAM40 model fields (below) suggested that the “dynamic tropopause” (taken to be the pressure of the PV1.5 surface) descended to the 600-675 hPa pressure level just south of the low pressure center.
GOES-18 Air Mass RGB images, with contours of AK-NAM40 model PV1.5 pressure [click to play animated GIF | MP4]
Gridded NUCAPS Tropopause Height [click to enlarge]
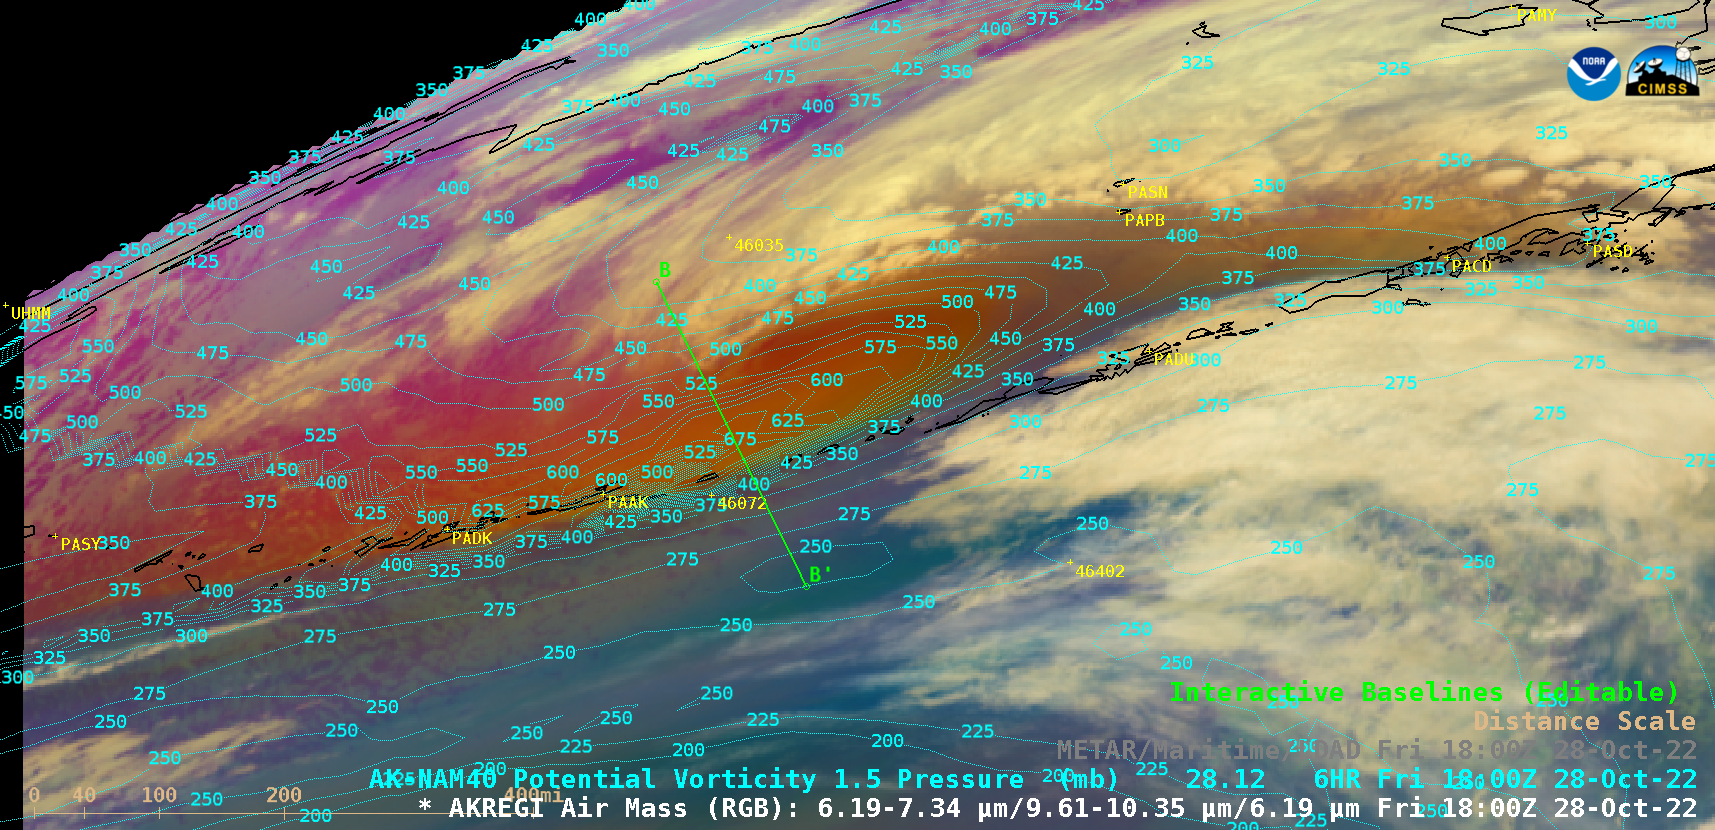
GOES-18 Air Mass RGB image at 1800 UTC, with contours of AK-NAM40 model PV1.5 pressure and Baseline B-B’ [click to enlarge]
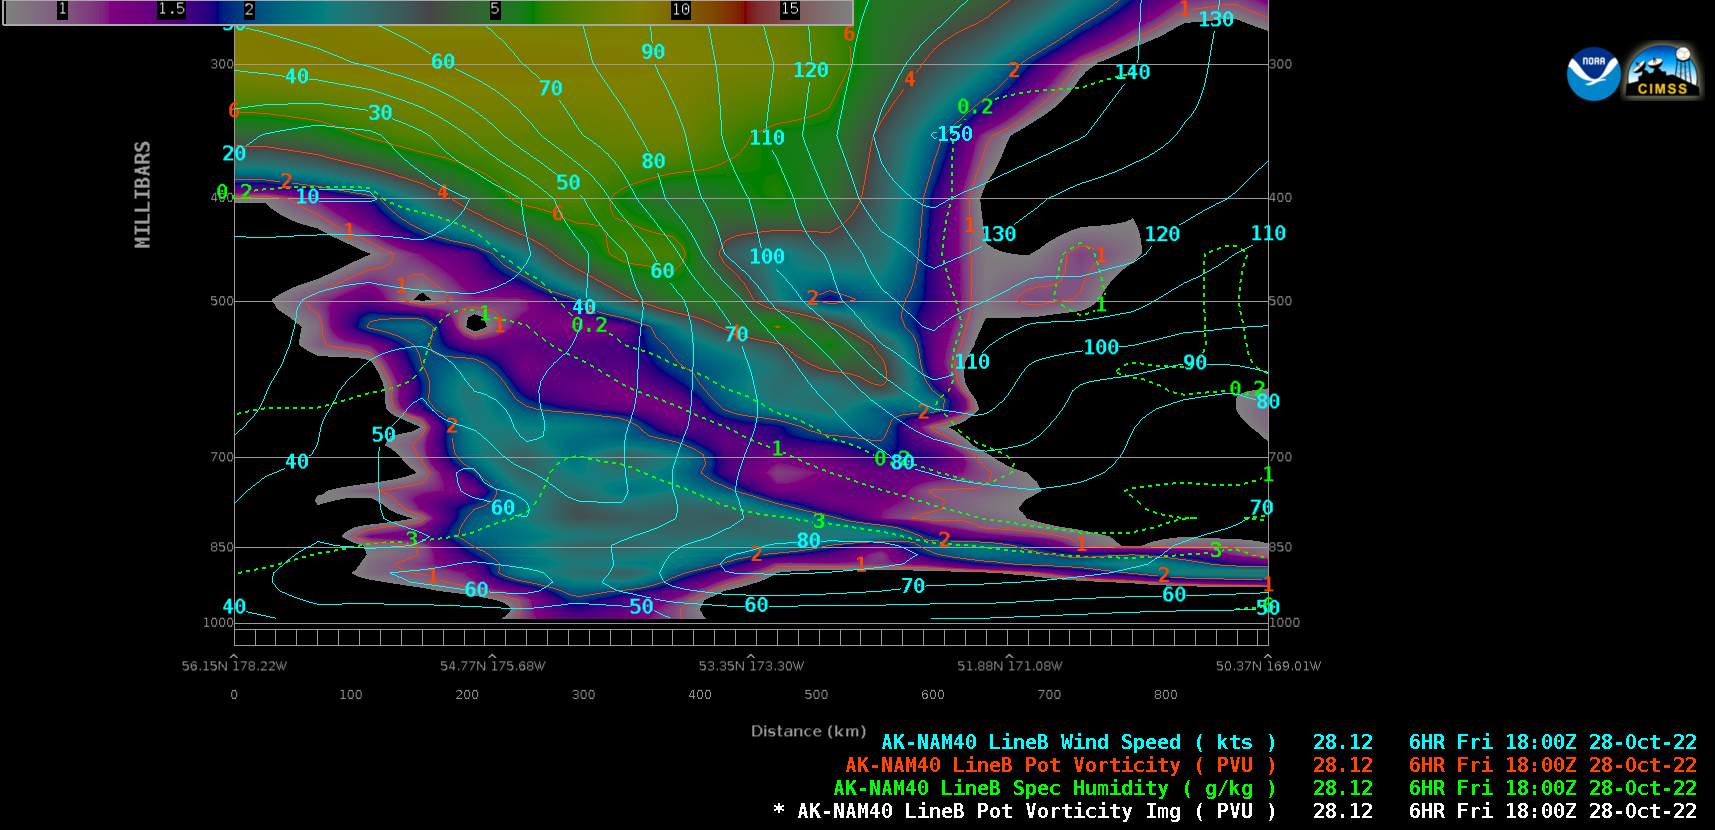
Cross section of AK-NAM40 model fields along Baseline B-B’, valid at 1800 UTC [click to enlarge]