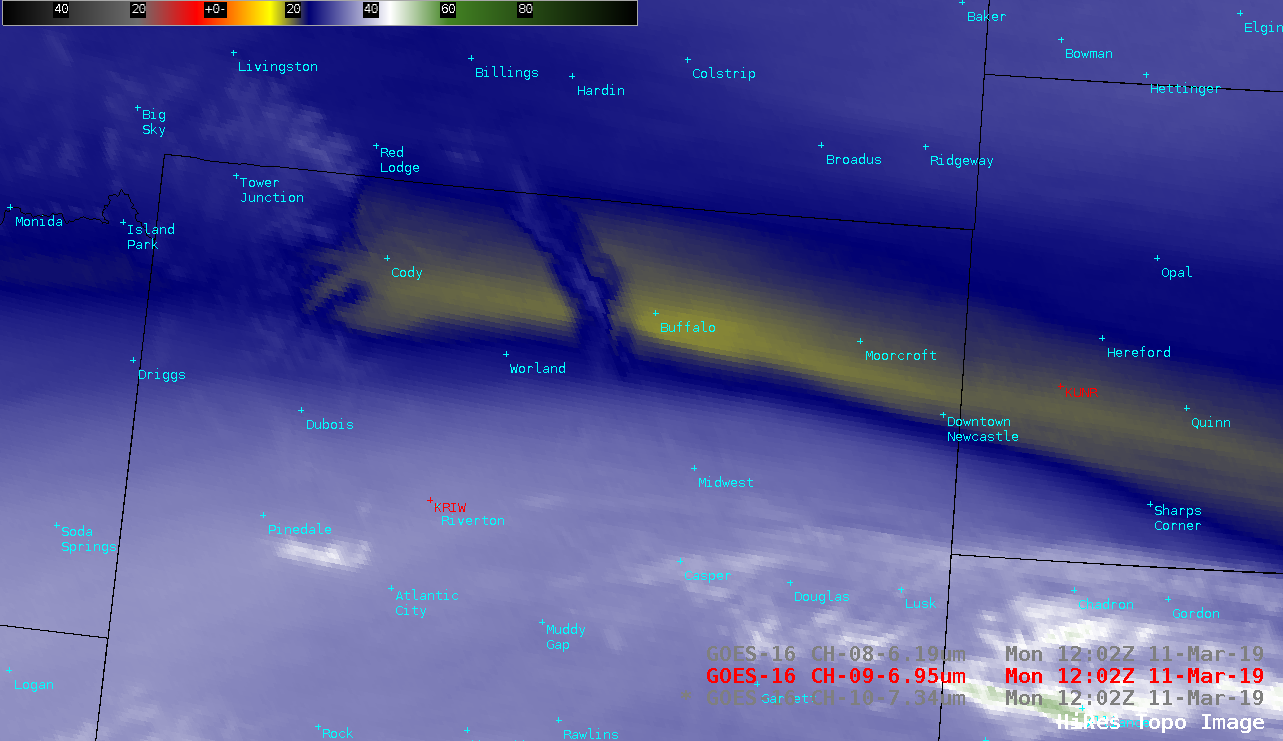
Dry air aloft over Wyoming and South Dakota
![GOES-16 Low-level (7.3 µm), Mid-level (6.9 µm) and Upper-level (6.2 µm) Water Vapor images, with topography [click to play animation | MP4]](https://cimss.ssec.wisc.edu/satellite-blog/wp-content/uploads/sites/5/2019/03/wy_wv9-20190311_090212.png)
GOES-16 Low-level (7.3 µm), Mid-level (6.9 µm) and Upper-level (6.2 µm) Water Vapor images, with topography [click to play MP4 animation]
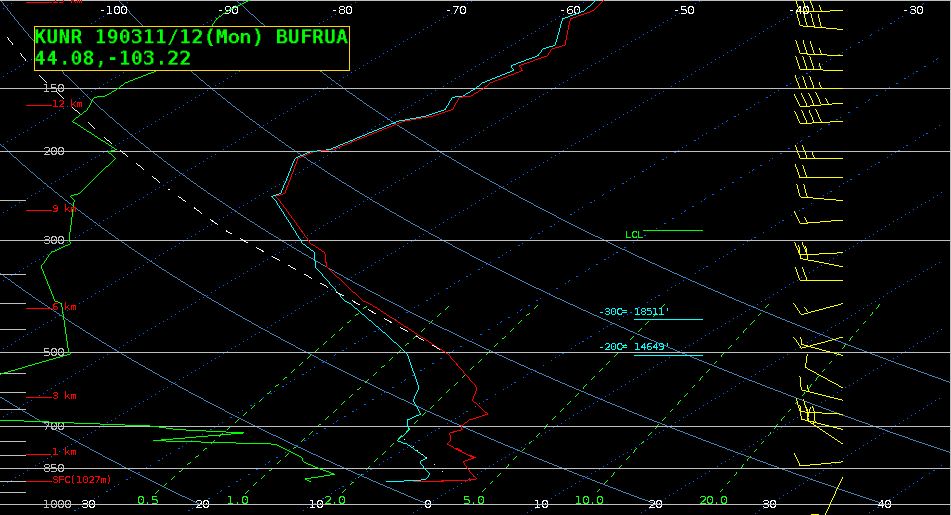
At 12 UTC the Rapid City SD (KUNR) sounding sampled this filament of dry air, but the Riverton WY (KRIW) sounding — even though it was closer to the Bighorn Mountains — did not, due to the presence of moist air throughout much of the middle/upper-troposphere over southern and central Wyoming. As a result, the Rapid City water vapor weighting functions peaked at a lower altitude than those for Riverton (below), thus enabling the Bighorn Mountain thermal signature to be seen. In the animation above, note how the mountain signature eventually became masked, especially in the 6.9 µm and 6.2 µm imagery, as the middle/upper-tropospheric moisture moved slowly northward during the day. As was the case over Riverton at 12 UTC, this high-altitude moisture absorbed upwelling surface radiation, then re-radiated it at the colder ambient temperature of the atmospheric layer where it existed.
![GOES-16 Water Vapor weighting functions, calculated using rawinsonde data from Rapid City SD and Riverton WY [click to enlarge]](https://cimss.ssec.wisc.edu/satellite-blog/wp-content/uploads/sites/5/2019/03/190311_12utc_kunr_kriw_waterVapor_weightingFunctions_anim.gif)
GOES-16 Water Vapor weighting functions, calculated using rawinsonde data from Rapid City SD and Riverton WY [click to enlarge]
![GOES-17 and GOES-16 Upper-level Water Vapor (6.2 µm) images [click to enlarge]](https://cimss.ssec.wisc.edu/satellite-blog/wp-content/uploads/sites/5/2019/03/190311_1202utc_goes17_vs_goes16_waterVapor_WY_SD_anim.gif)
GOES-17 and GOES-16 Upper-level Water Vapor (6.2 µm) images [click to enlarge]
![Plot of mean 6.2 µm brightness temperature difference between GOES-17 and GOES-16 [click to enlarge]](https://cimss.ssec.wisc.edu/satellite-blog/wp-content/uploads/sites/5/2019/03/GOES17_FPMTemp_GOES16vsGOES17MeanDiff_CONUS_2019070_120218_Band08.png)
Plot of the mean 6.2 µm brightness temperature difference between GOES-17 and GOES-16 (blue) along with the GOES-17 ABI Focal Plane Mirror temperature (black) [click to enlarge]
![Rapid City SD Water Vapor weighting functions for GOES-17 and GOES-16 [click to enlarge]](https://cimss.ssec.wisc.edu/satellite-blog/wp-content/uploads/sites/5/2019/03/190311_12utc_kunr_waterVapor_weightingFunctions_goes16_vs_goes17_anim.gif)
Rapid City SD Water Vapor weighting functions for GOES-17 vs GOES-16 [click to enlarge]