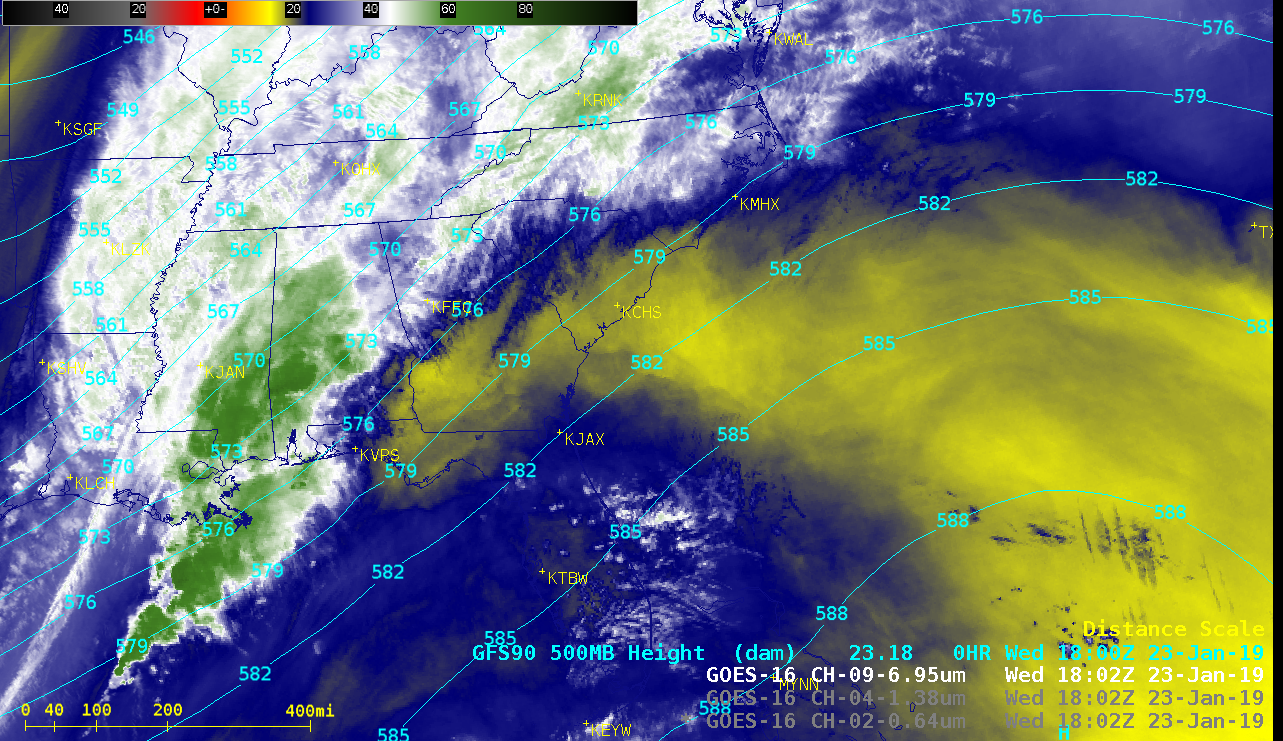
Dry air aloft over the western Atlantic Ocean
![GOES-16 Mid-level Water Vapor (6.9 µm) images, with plots of rawinsonde sites in yellow [click to play animation | MP4]](https://cimss.ssec.wisc.edu/satellite-blog/wp-content/uploads/sites/5/2019/01/190123_goes16_waterVapor_Atlantic_marine_stratocumulus_anim.gif)
GOES-16 Mid-level Water Vapor (6.9 µm) images, with rawinsonde sites plotted in yellow [click to play animation | MP4]
GOES-16 “Red” Visible (0.64 µm) images showed that marine boundary layer stratocumulus clouds covered much of this region of the Atlantic — and due to minimal absorption by mid-tropospheric water vapor, these stratocumulus clouds were also very apparent in the corresponding GOES-16 Near-Infrared “Cirrus” (1.38 µm) images (below).
![GOES-16 "Red" Visible (0.64 µm) and Near-Infrared "Cirrus" (1.37 µm) images, with plots of rawinsonde sites in yellow [click to play animation | MP4]](https://cimss.ssec.wisc.edu/satellite-blog/wp-content/uploads/sites/5/2019/01/190123_goes16_visible_cirrus_Atlantic_marine_stratocumulus_anim.gif)
GOES-16 “Red” Visible (0.64 µm) and Near-Infrared “Cirrus” (1.38 µm) images, with rawinsonde sites plotted in yellow [click to play animation | MP4]
![Terra MODIS Visible <em>(0.65 µm)</em> and Near-Infrared "Cirrus" <em>(1.38 µm)</em> images at 1513 UTC, with plots of rawinsonde sites in yellow [click to enlarge]](https://cimss.ssec.wisc.edu/satellite-blog/wp-content/uploads/sites/5/2019/01/190123_1513utc_terra_modis_visible_cirrus_Atlantic_marine_stratocumulus_anim.gif)
Terra MODIS Visible (0.65 µm) and Near-Infrared “Cirrus” (1.38 µm) images at 1513 UTC, with rawinsonde sites plotted in yellow [click to enlarge]
![Cross sections of GFS90 model fields along Line I-I', from Charleston, South Carolina to Bermuda [click to enlarge]](https://cimss.ssec.wisc.edu/satellite-blog/wp-content/uploads/sites/5/2019/01/190123_18utc_gfs90_cross_section_KCHS_TXKF_anim.gif)
Cross sections of GFS90 model fields along Line I-I’, from Charleston, South Carolina to Bermuda [click to enlarge]