Dry aloft over the western US
![GOES-17 Mid-level (6.9 µm) Water Vapor image, with contours of NAM40 model geoptential height [click to enlarge]](https://cimss.ssec.wisc.edu/satellite-blog/wp-content/uploads/sites/5/2019/01/ca_wv_nam_500_height-20190113_120218.png)
GOES-17 Mid-level Water Vapor (6.9 µm) image, with contours of NAM40 model 500 hPa geopotential height [click to enlarge]
* GOES-17 images shown here are preliminary and non-operational *
A GOES-17 Mid-level (6.9 µm) Water Vapor image with contours of NAM40 model 500 hPa geopotential height (above) showed an arc of dry air aloft over the far western US at 1202 UTC on 13 January 2019. This was a classic example of an “inside blocking” boundary as described by Weldon and Holmes, 1991 (page 75) — following middle/upper-tropospheric anticyclogenesis, an easterly flow of dry (via a period of synoptic-scale sinking) air on the equatorward side of the high pressure eventually becomes elongated within a deformation zone, acting to either completely block or slow the arrival of an upstream flow of moisture from the west. The arrival of a dry easterly flow aloft was very evident in a sequence of plots of rawinsonde data from Reno, Nevada during the period 12 January/12 UTC to 13 January/12 UTC (below). At 12 UTC on 13 January the Total Precipitable Water at Reno was 3.3 mm or 0.13 inch (their mean value for that day/time is 7.9 mm or 0.31 inch).
![Plots of rawinsonde data from Reno, Nevada during the period 12 January/12 UTC to 13 January/12 UTC [click to enlarge]](https://cimss.ssec.wisc.edu/satellite-blog/wp-content/uploads/sites/5/2019/01/190112_190113_krev_raobs_anim.gif)
Plots of rawinsonde data from Reno, Nevada during the period 12 January/12 UTC to 13 January/12 UTC [click to enlarge]
![Plots of GOES-17 Water Vapor weighting functions, calculated using rawinsonde data from Reno, Nevada (12 UTC on 12 January to 12 UTC on 13 January) [click to enlarge]](https://cimss.ssec.wisc.edu/satellite-blog/wp-content/uploads/sites/5/2019/01/190112_190113_krev_goes17_waterVapor_weightingFunctions_anim.gif)
Plots of GOES-17 Water Vapor weighting functions, calculated using rawinsonde data from Reno, Nevada (12 January/12 UTC to 13 January/12 UTC) [click to enlarge]
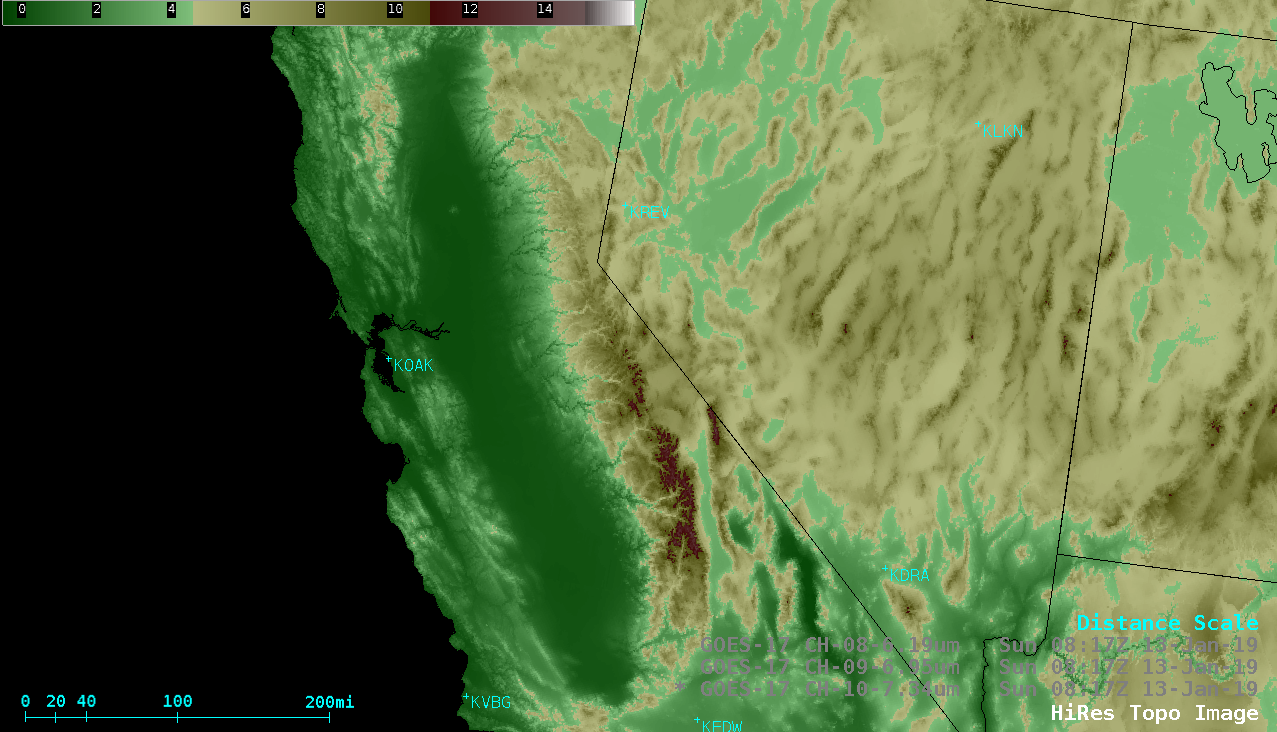
![GOES-17 Low-level (7.3 µm), Mid-level (6.9 µm) and Upper-level (6.2 µm) Water Vapor images [click to play animation | MP4]](https://cimss.ssec.wisc.edu/satellite-blog/wp-content/uploads/sites/5/2019/01/190113_goes17_waterVapor_Sierra_Nevada_anim.gif)
GOES-17 Low-level (7.3 µm), Mid-level (6.9 µm) and Upper-level (6.2 µm) Water Vapor images [click to play animation | MP4]
GOES-17 “Red” Visible (0.64 µm) and Near-Infrared “Cirrus” (1.37 µm) images [click to play animation | MP4]