Lightning at a Football Game
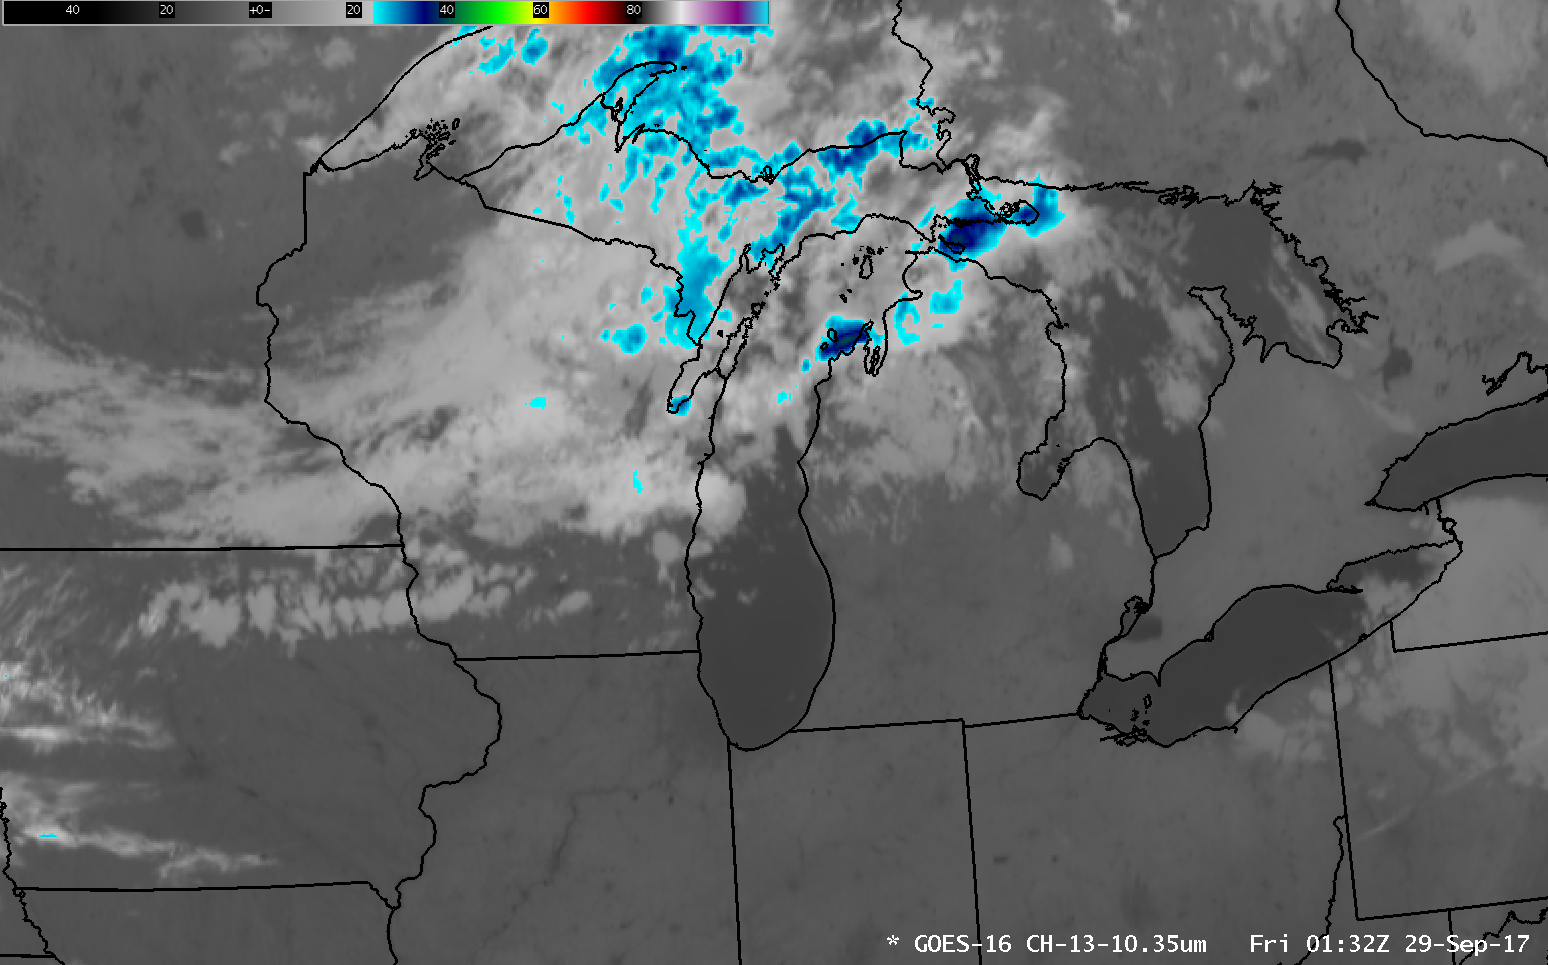
GOES-16 ABI Channel 13 (“Clean Window”, 10.3 µm) Infrared Imagery, 2202 UTC 28 September to 0302 UTC 29 September 2017 (Click to animate)
GOES-16 data posted on this page are preliminary, non-operational and are undergoing testing
The National Football League football game between the destined-to-win Green Bay Packers and the woeful Chicago Bears was interrupted by lightning at the end of the First Quarter on Thursday 29 September 2017. The animation of GOES-16 “Clean Window” 10.3 µm infrared imagery, above, shows a cold front passing easily through the area (in much the same way that Aaron Rodgers passed through the Bears Defense). The slow (slow, but not as slow as the Bears’ Offense) animation, below, shows the coldest cloud top moving over Green Bay at around 0130 UTC. Note that there is a parallax shift in this image: the storm top is displayed north of its actual ground location.
GOES-16 ABI Channel 13 (“Clean Window”, 10.3 µm) Infrared Imagery, 2202 UTC 28 September to 0302 UTC 29 September 2017 (Click to animate)
The UW CIMSS ProbSevere product (from here, Click here for an updated version that includes ProbTor/ProbWind/ProbHail) includes Total Lightning (from the ground network) as one of its predictors, and the stepped animation below, showing 0100, 0115 and 0130 UTC, highlights the lightning-producing cell that delayed the game. The Probability of Severe weather (Severe being defined as a Tornado, Hail exceeding 1″ in Diameter, and/or winds exceeding 50 knots) was very small (though not as small as the Bears’ chances), but note that lightning flashes, 2-3 flashes per minute, are consistently observed.
NOAA/CIMSS ProbSevere, 0100, 0115 and 0130 UTC on 29 September 2017 (Click to enlarge)
A new-to-operations instrument that is on board GOES-16 is the Geostationary Lightning Mapper (GLM). Preliminary observations from this instrument, below, show that it too detected the lightning as it approached the stadium. The GLM pixel size is 8 kilometers at the sub-satellite point, a pixel size that is significantly larger than the GOES-16 ABI Pixel size (10.3 µm, with a pixel size of 2 km at the sub-satellite point, is shown below). Whereas ground-based lightning detection systems detect only cloud-to-ground lightning, the optical detectors on GLM detect both cloud-to-ground and in-cloud lightning. Typically, a cloud will produce in-cloud lightning before cloud-to-ground, so the GLM can alert a forecaster to potentially dangerous lightning with more lead-time than is possible with ground-based systems. The animation below starts with the first detection at 0030 UTC on 29 September, about 45 minutes before Lambeau Field was evacuated, and 10 minutes before ground-based sensors detected cloud-to-ground strokes. (the evacuation occurred at about 0115 UTC) Group Density is plotted on top of the GOES-16 10.3 µm ABI (the ABI has a grey-scale enhancement). Note the relatively large pixel size of the GLM, and the obvious parallax shift between the two fields. The strengths of the GLM for lightning safety at large outdoor events is obvious in this case.
GOES-16 ABI “Clean Window” (10.3 µm) Imagery and GLM Group Density, every 5 minutes from 0030-0130 UTC on 29 September 2017 (Click to animate)
Go Pack!!