Hurricane Harvey
GOES-16 “Clean Window” Infrared (10.3 µm) images, 0432-1307 UTC on 24 August 2017 [click to play animation]
Overnight Satellite imagery from GOES-16, above, shows an increase in the size and convective activity with then-Tropical Storm Harvey. Harvey is forecast to make landfall on the Texas Gulf Coast (See the National Hurricane Center website for further details), and conditions favor strengthening. One of the favorable conditions is shown in the animation of Total Precipitable Water, below, from this site. There is abundant moisture surrounding the storm, extending into eastern and southeastern Texas. Flooding rains will likely precede and accompany this storm.
In addition to abundant moisture, Harvey’s projected path takes it over very deep very warm water (Link showing Oceanic Heat Content).
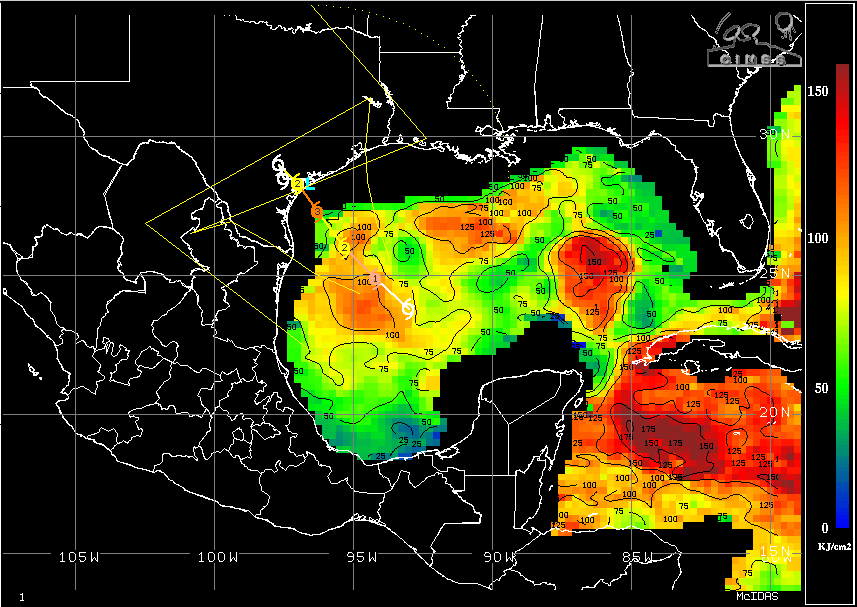
Note: Harvey achieved Hurricane Status at 1 PM CDT on 24 August 2017. Harvey continued to rapidly intensify during the day (ADT | SATCON).
MIMIC Total Precipitable Water, 24-hour animation ending at 1200 UTC 24 August 2017 [click to enlarge]
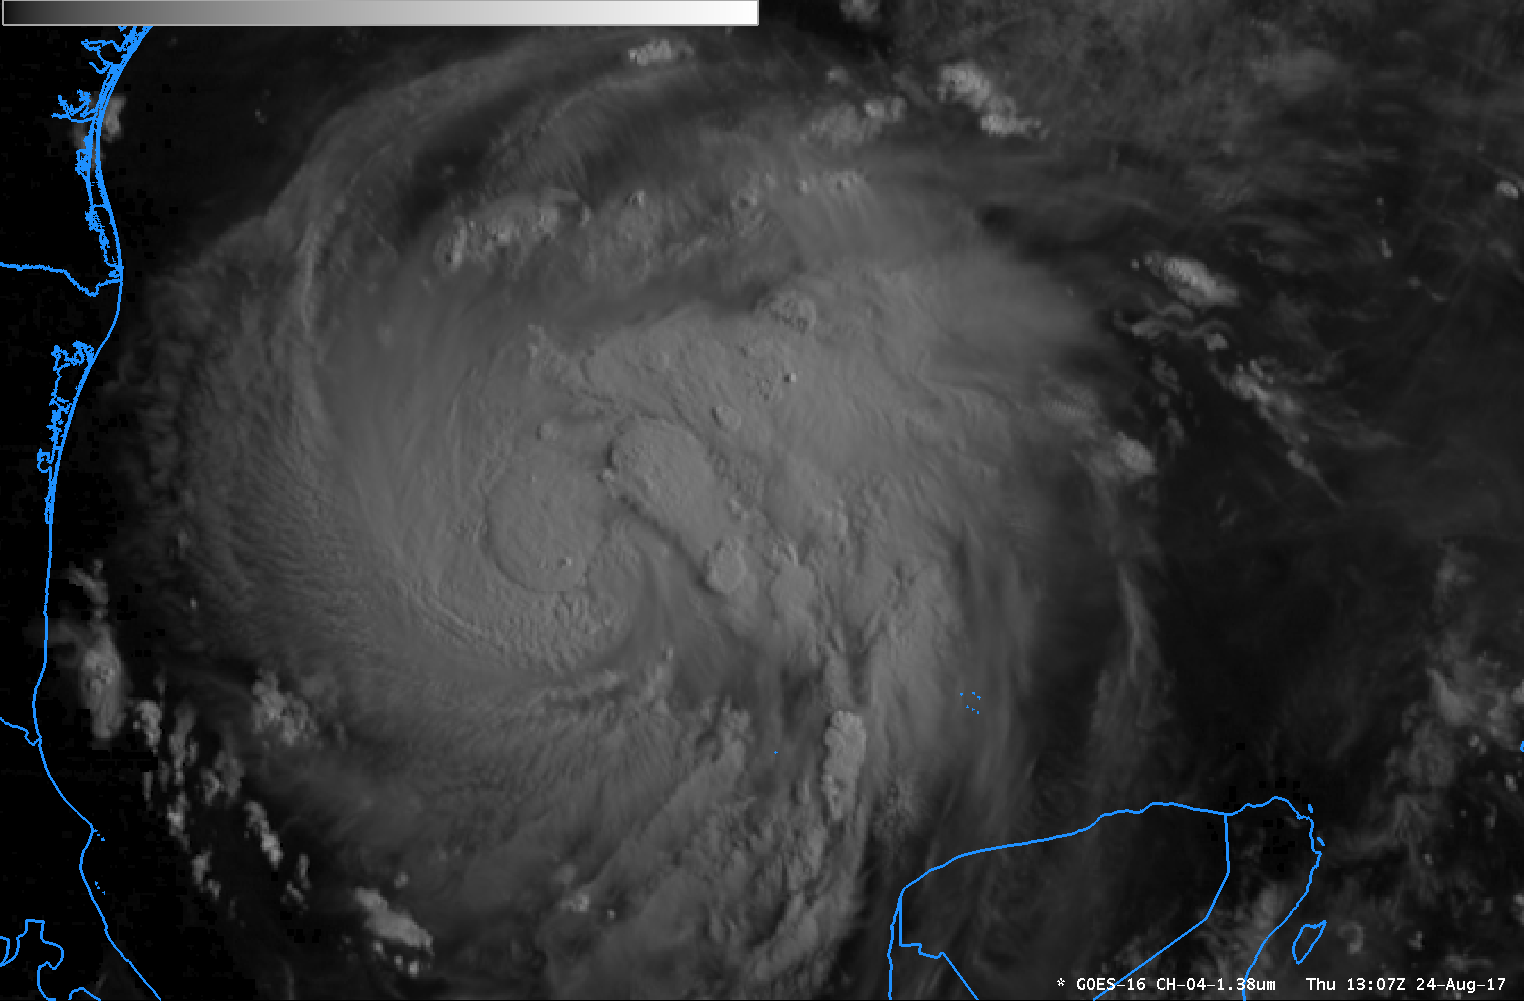
GOES-16 “Cirrus Channel” (1.38 µm) Imagery, 1307 UTC on 24 August 2017 (Click to enlarge)
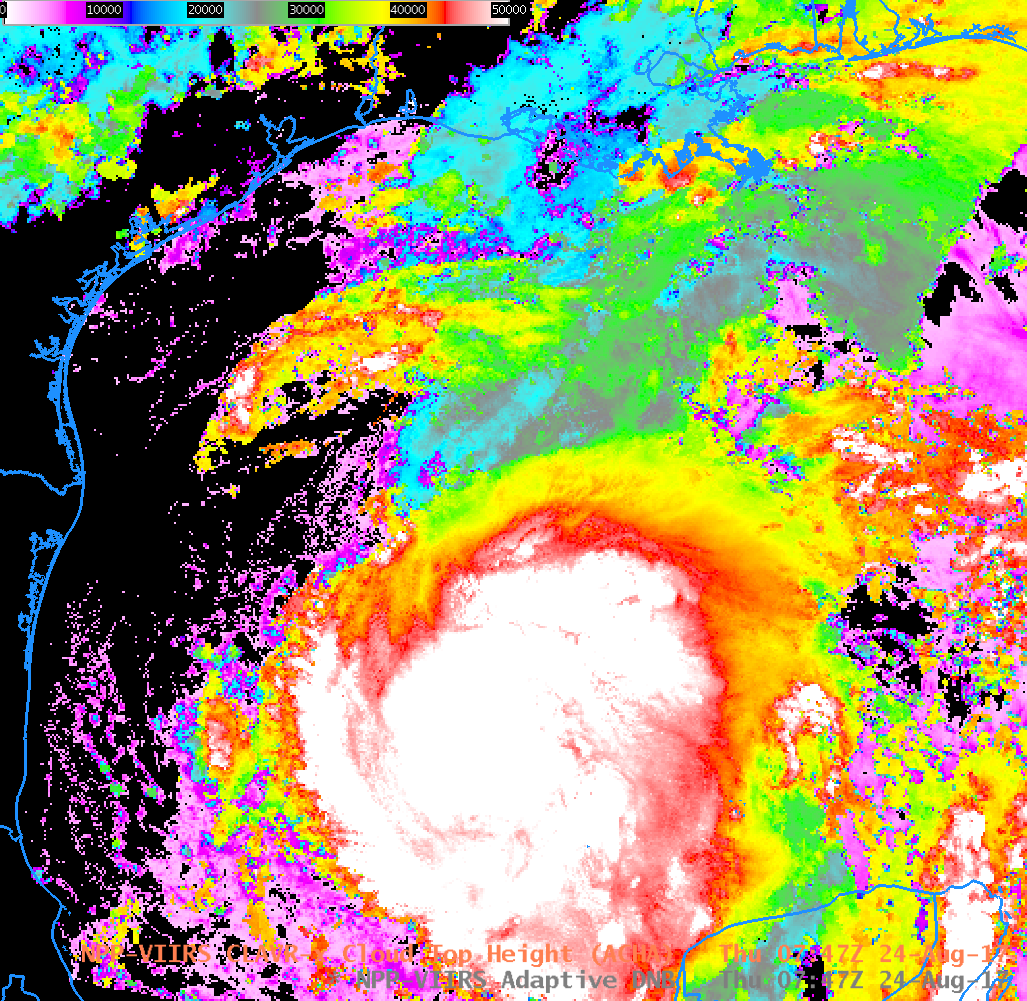
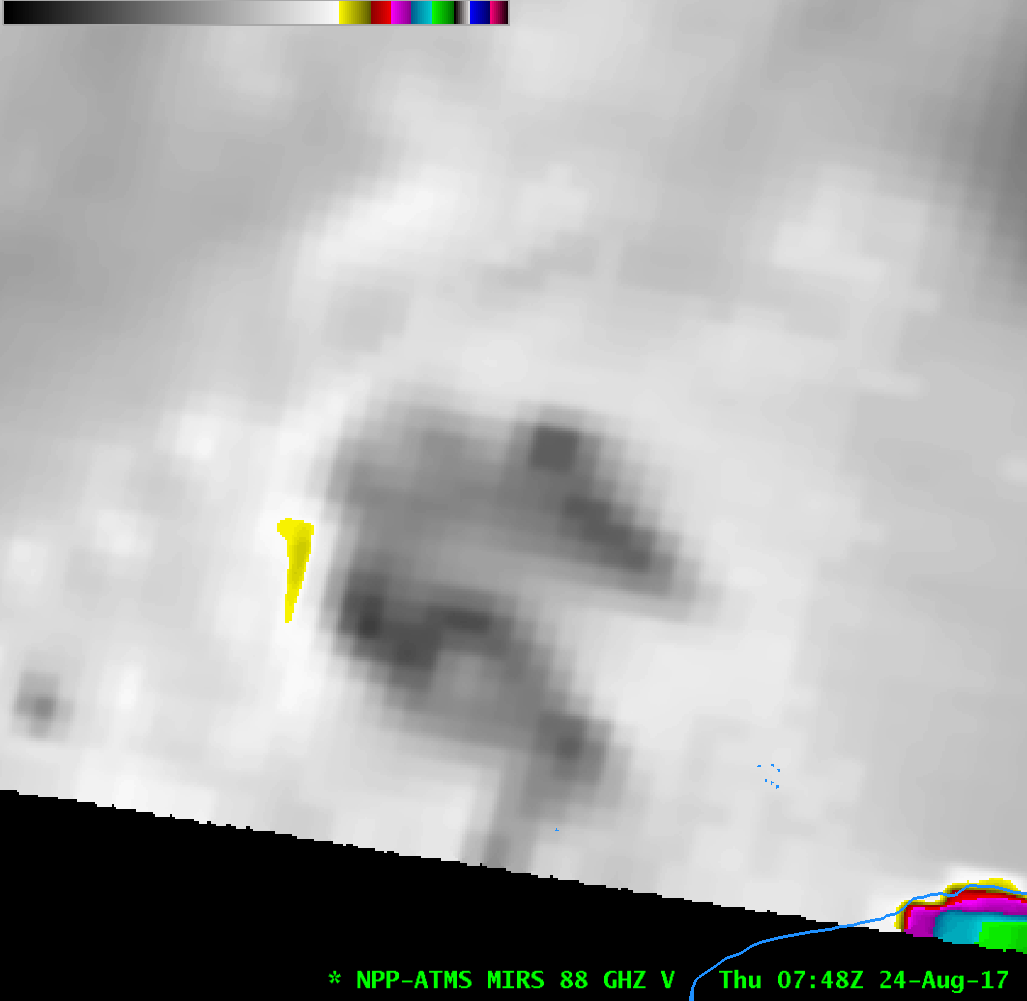
Suomi NPP overflew the southern Gulf after midnight on 24 August 2017, and the VIIRS Day/Night Band Imagery, below, shows a few lightning streaks in the storm that is barely illuminated by airglow. Cloud-top heights computed from VIIRS data (Link) shows a large central dense overcast with heights exceeding 50000 feet. ATMS 88-GHz Imagery at the same time is shown here. Morphed Microwave imagery (from this site) hints at the development of a ragged eye shortly after sunrise on 24 August. (Animation). (A DMSP SSMI 85 GHz still image from near the end of the MIMIC animation is here).
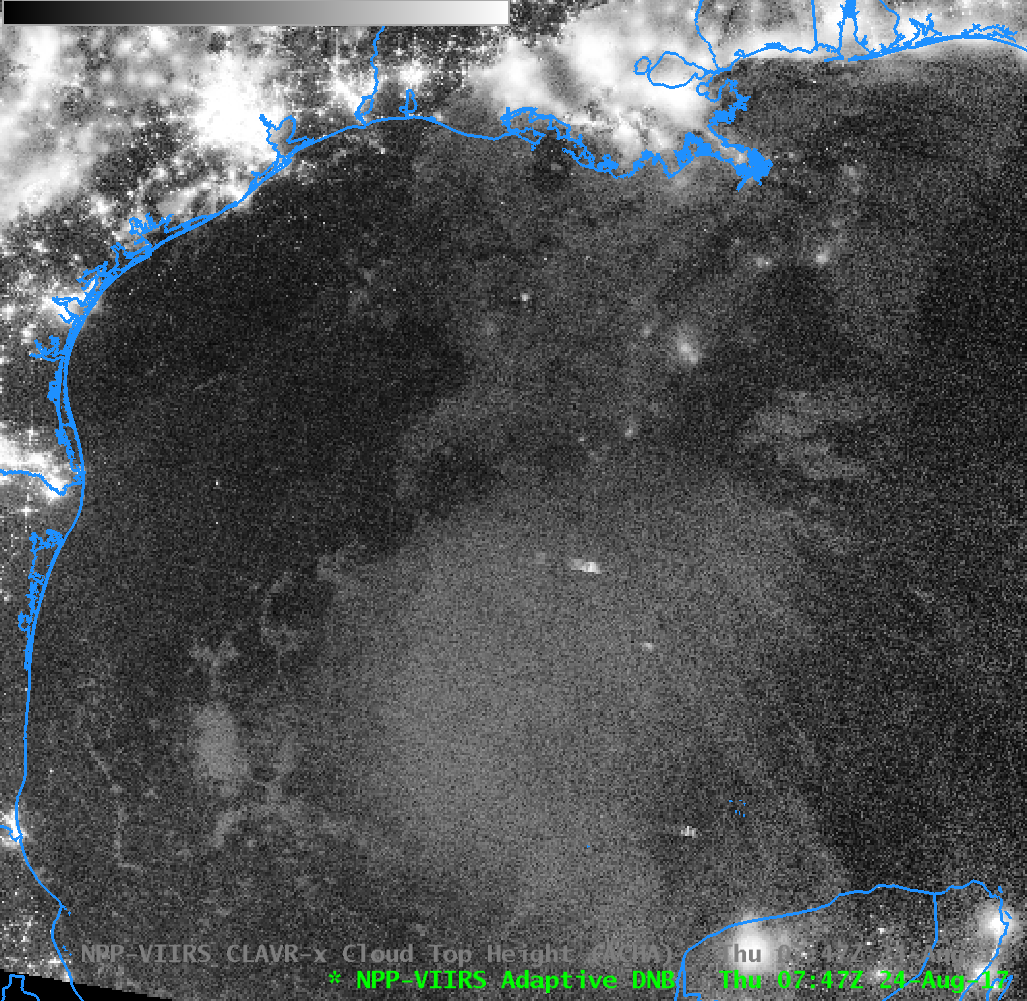
Suomi NPP Day Night Band Visible (0.70 µm) Imagery over Tropical Storm Harvey, 0747 UTC on 24 August 2017 (Click to enlarge)
ATMS 88-GHz Imagery at the same time is shown here. Morphed Microwave imagery (from this site) hints at the development of a ragged eye shortly after sunrise on 24 August. (Animation). An 85 GHz still image from the end of the animation is shown below.
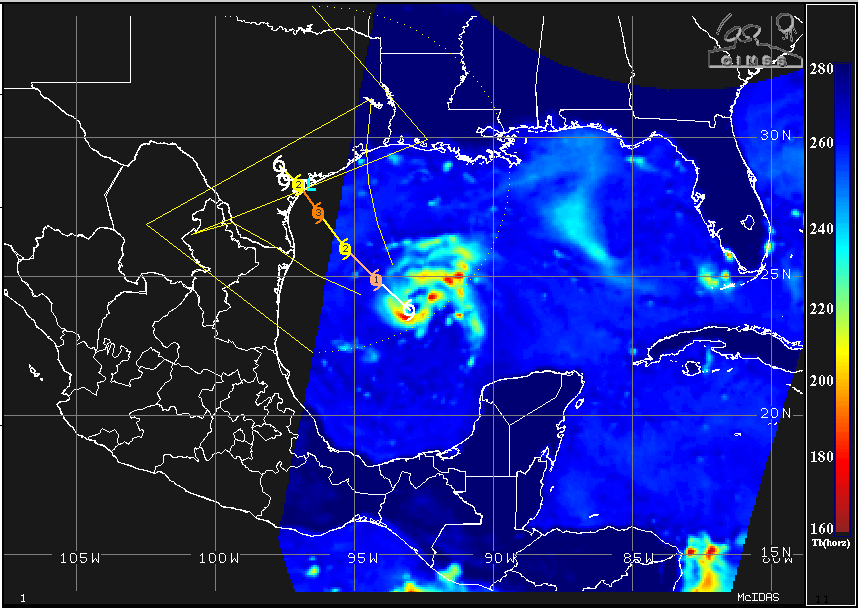
85 GHz Microwave imagery over Tropical Storm Harvey, 1300 UTC on 24 August 2017 (Click to enlarge)
Later in the day, a toggle between 1912 UTC Visible (0.64 µm) and Infrared Window (11.45 µm) Suomi NPP VIIRS images, below, provided a detailed view of the hurricane.
Suomi NPP VIIRS Visible (0.64 µm) and Infrared Window (11.45 µm) images (Click to enlarge)
For more information on Hurricane Harvey, a storm that people along the Texas Gulf Coast should be monitoring closely, consult the website of the National Hurricane Center, or the CIMSS Tropical Weather Website.