SRSO-R Imagery of convection over the Upper Midwest
")
GOES-14 0.63 µm visible channel images (click image to play animation)
A cold front moving through Wisconsin triggered severe convection (SPC storm reports) on 21 August 2013. GOES-14 SRSO-R data gives a compelling look at the convective development at 1-minute intervals. Because of the satellite position, the rear inflow into the convection near Rice Lake, WI, is very apparent.
It is useful to compare the SRSO-R views of the convection from GOES-14 (30-second imagery will be available with GOES-R) to the routine scanning strategy used by GOES-13. That comparison is shown below. Routine scanning is unable to capture the very dynamic nature of rapidly evolving convection.
 and GOES-13 (right) 0.63 µm visible channel images (click image to play animation)")
GOES-14 (left, SRSO-R) and GOES-13 (right) 0.63 µm visible channel images (click image to play animation)
Even Rapid Scan Operations (RSO) imagery (GOES-13 was in RSO during this event) can also miss important details, especially at times when GOES-East is doing a full-disk scan (at 20:45 UTC, for example) and no imagery is available for 30 minutes. The loop below compares SRSO views of this system (top) to RSO (middle) to standard 15-minute scanning (bottom). GOES-R will have the capability simultaneously to scan globally and in designated mesoscale sectors.
 0.63 µm visible channel images (click image to play animation)")
GOES-14 (SRSO-R, top; RSO, middle; standard, bottom) 0.63 µm visible channel images (click image to play animation)
")
GOES-13 Sounder DPI values of Lifted Index (click image to play animation)
GOES-13 sounder Derived Product Imagery (DPI) of the Lifted Index (above, available at this site) and Convective Available Potential Energy (below) readily shows the unstable airmass supporting the convection.
 product (click image to play animation)")
GOES-13 sounder Convective Available Potential Energy (CAPE) product (click image to play animation)
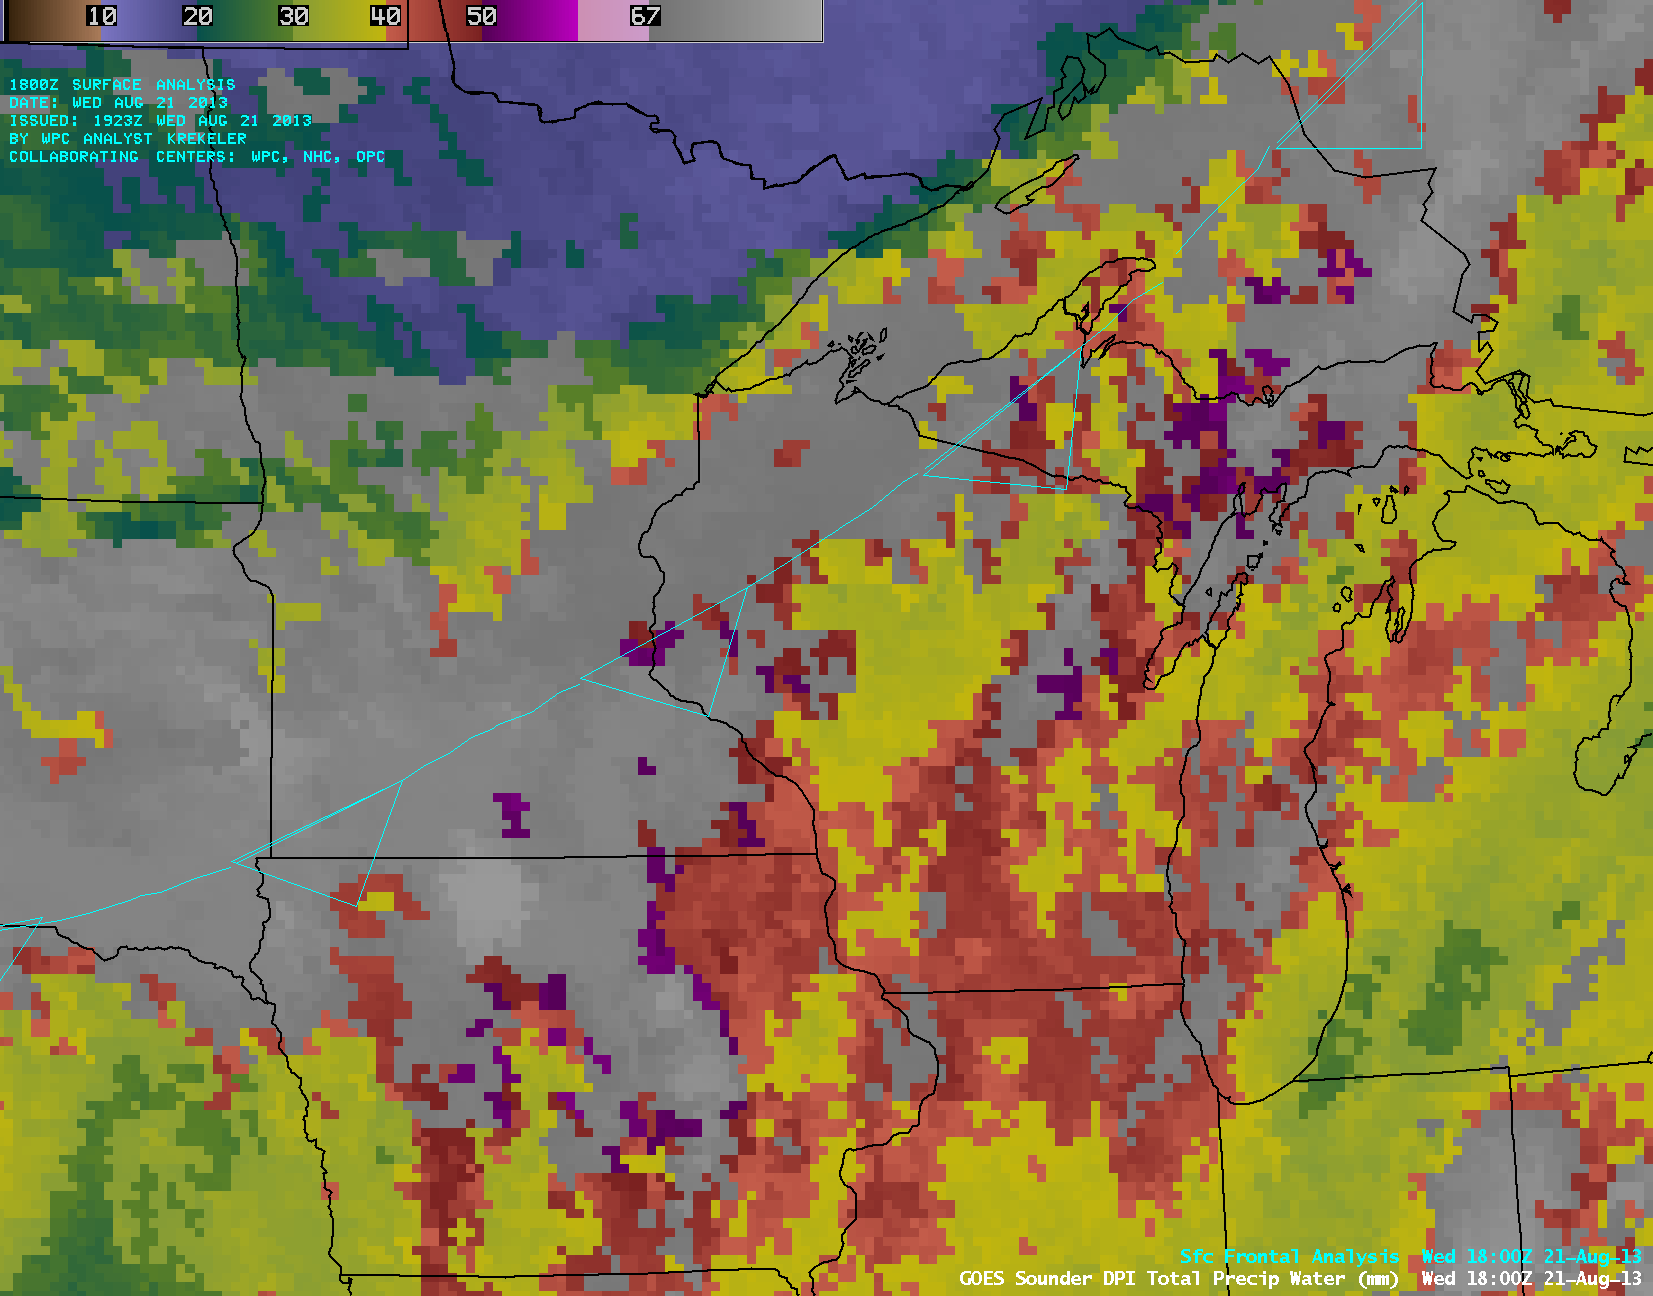
Total Precipitable Water (available at this site), below, shows moisture pooling along the approaching front.

GOES-13 Sounder DPI values of Total Precipitable Water