Differences in ice reflectivity over Hudson Bay
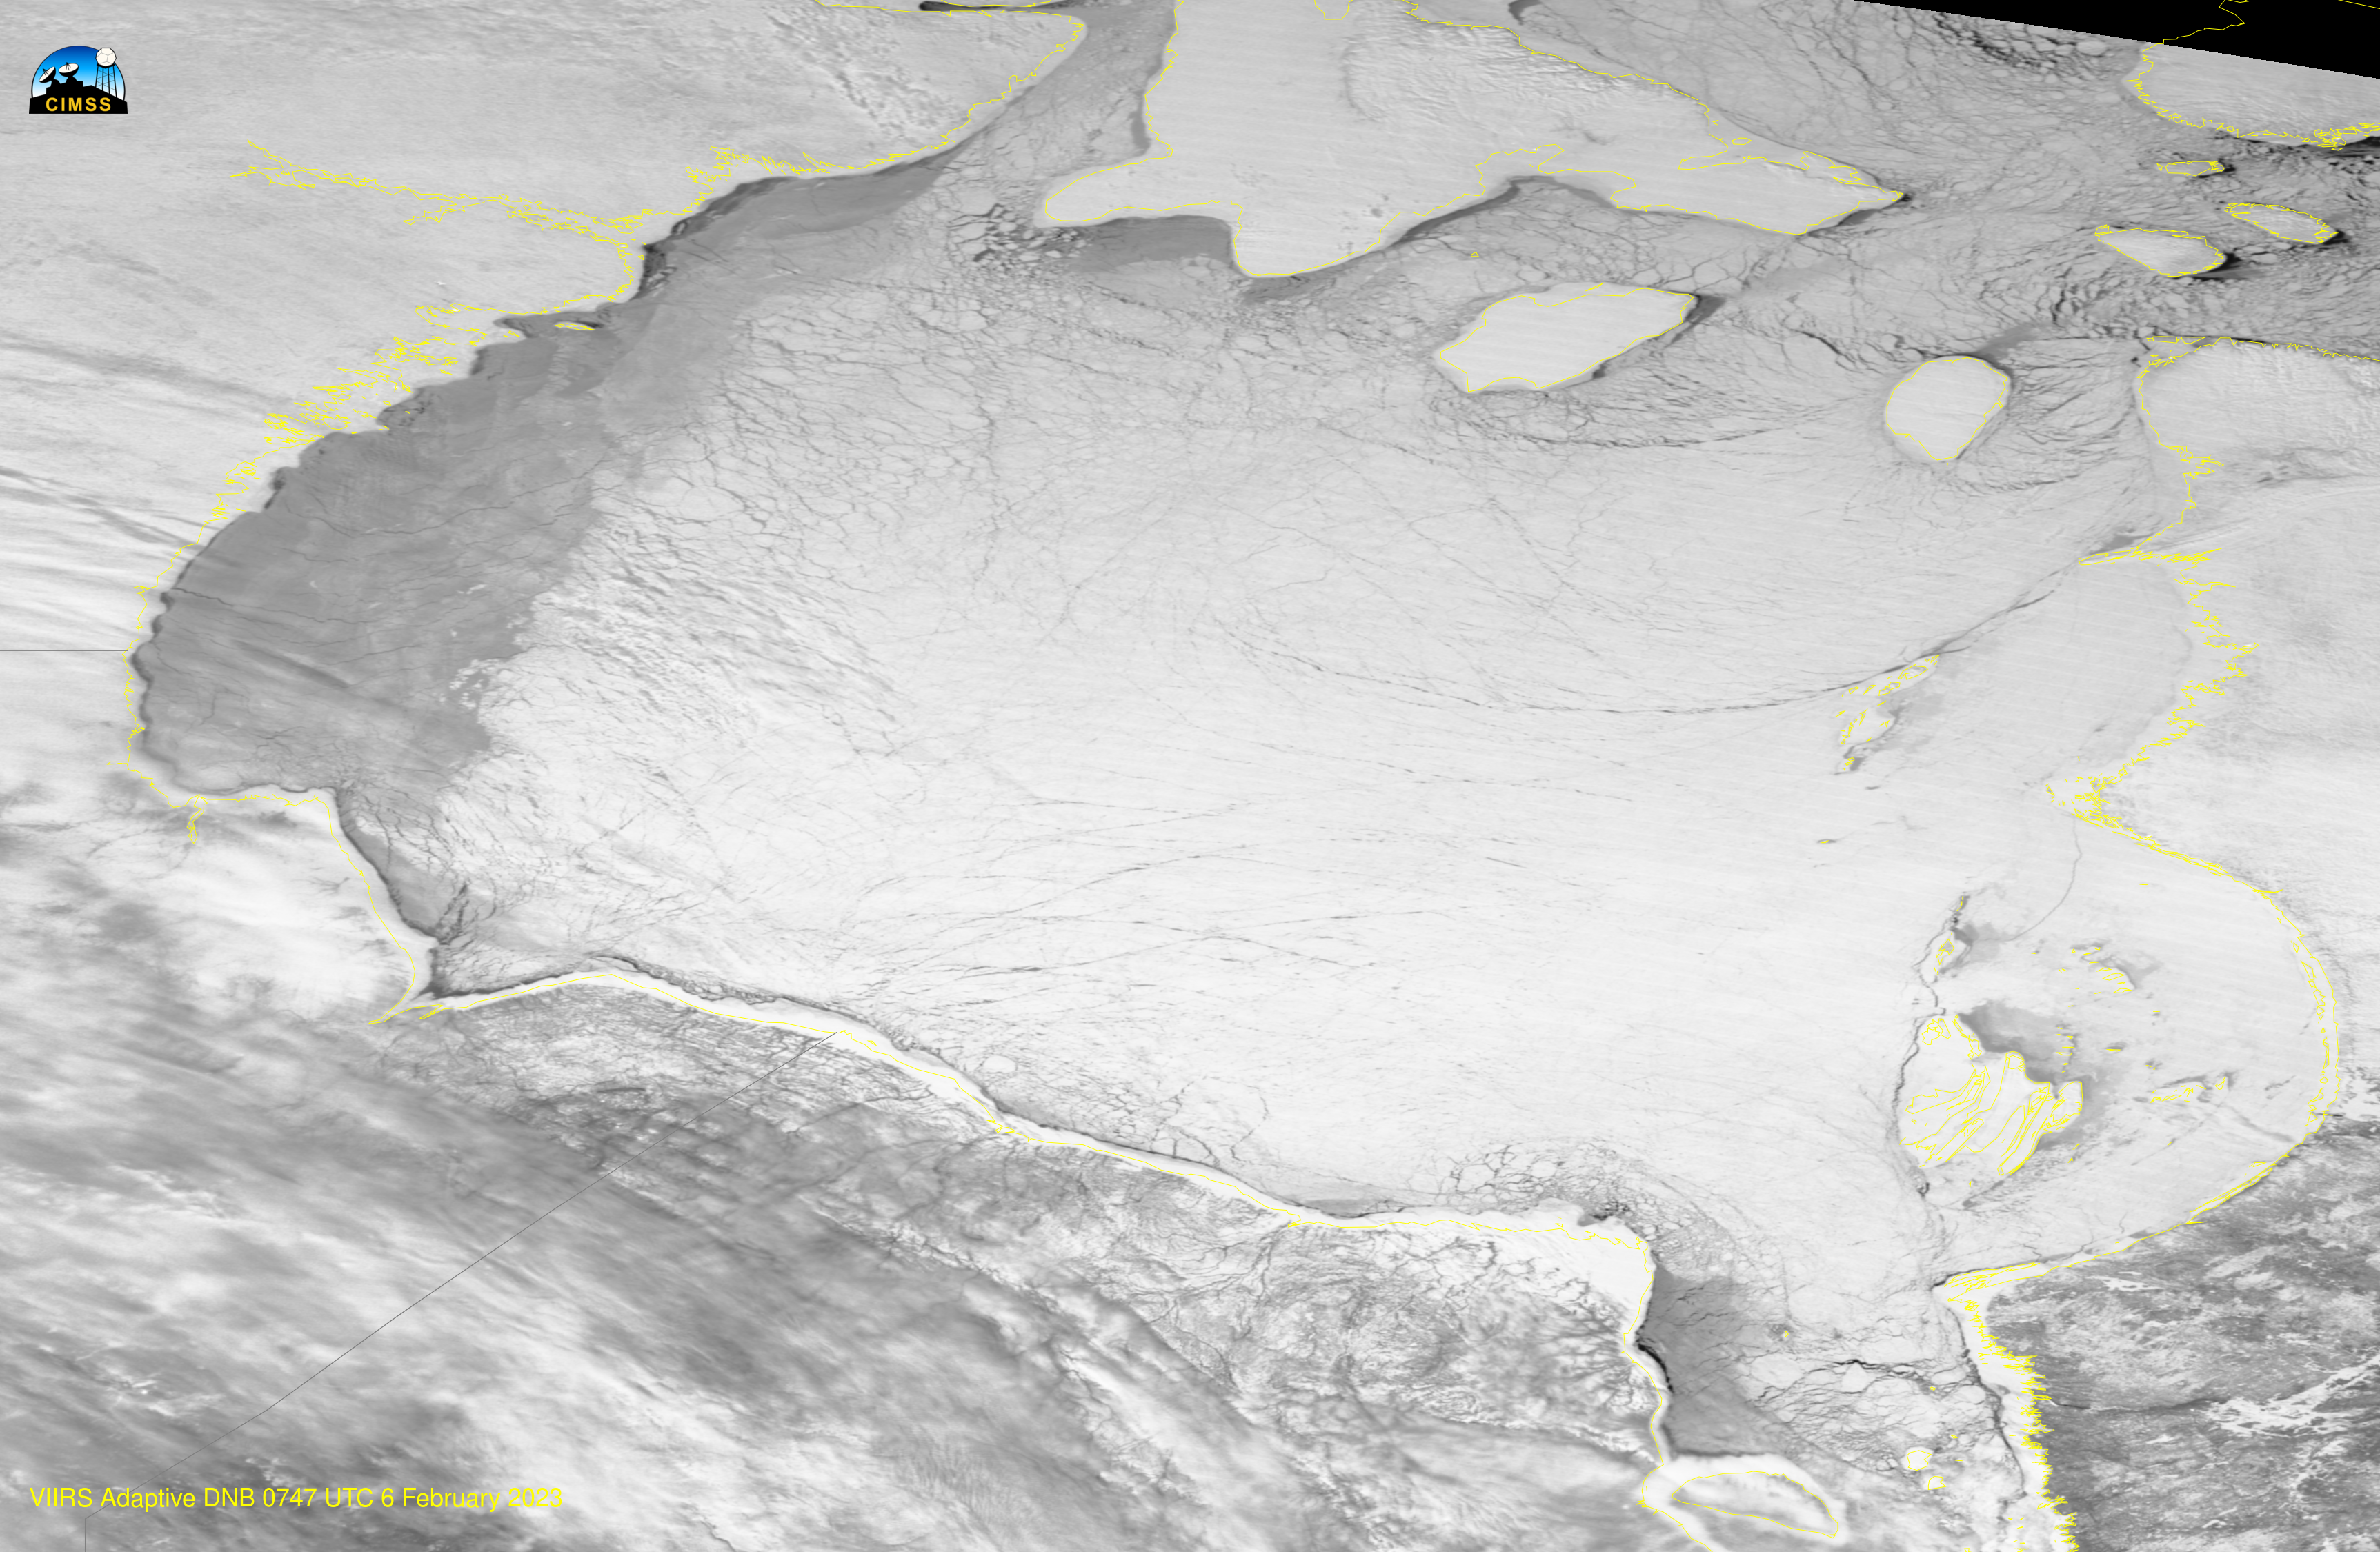
Daynight band imagery from the CIMSS Direct Broadcast antenna (processed by CSPP software) early on 6 February 2023 showed a curious region of darker reflectance over western Hudson Bay (VIIRS imagery is available from this temporary file; microwave imagery from ATMS at the same time is available from this temporary file). The toggle below, between the VIIRS I04 (3.74 µm) brightness temperature and the Dynamic Day Night Band imagery, shows that the darker ice is a warmer temperature, i.e., a darker shade of grey.
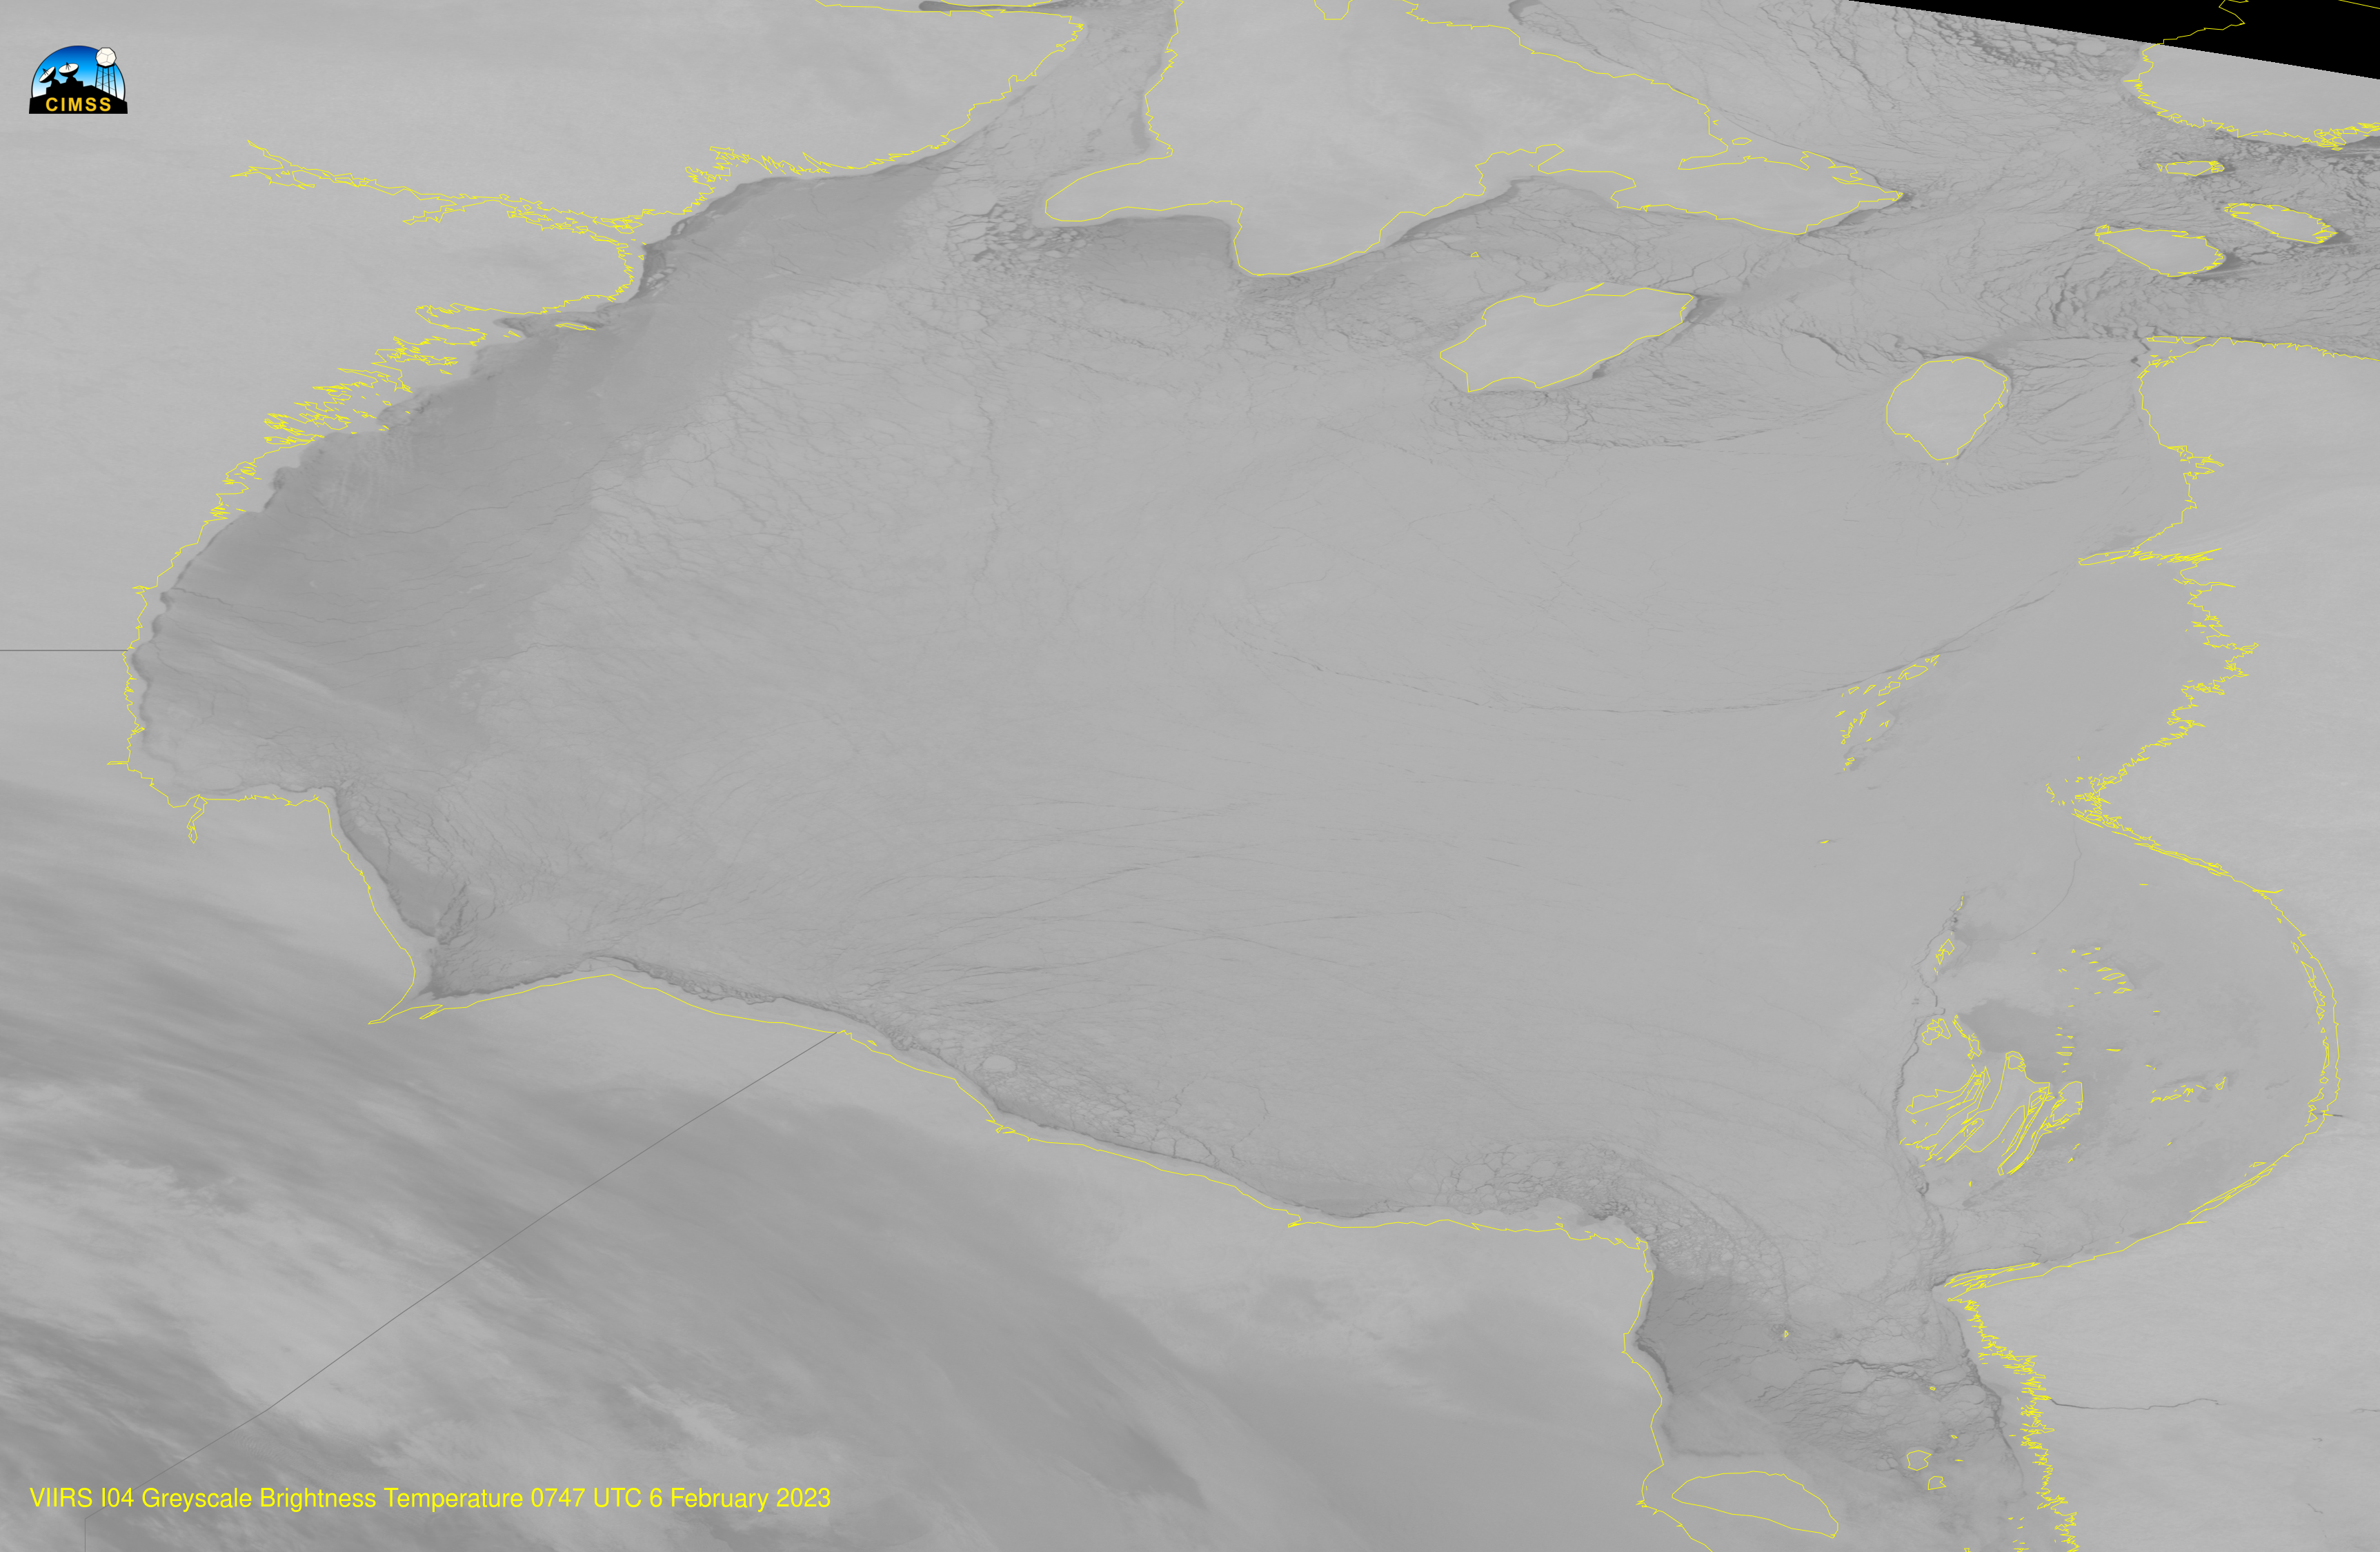
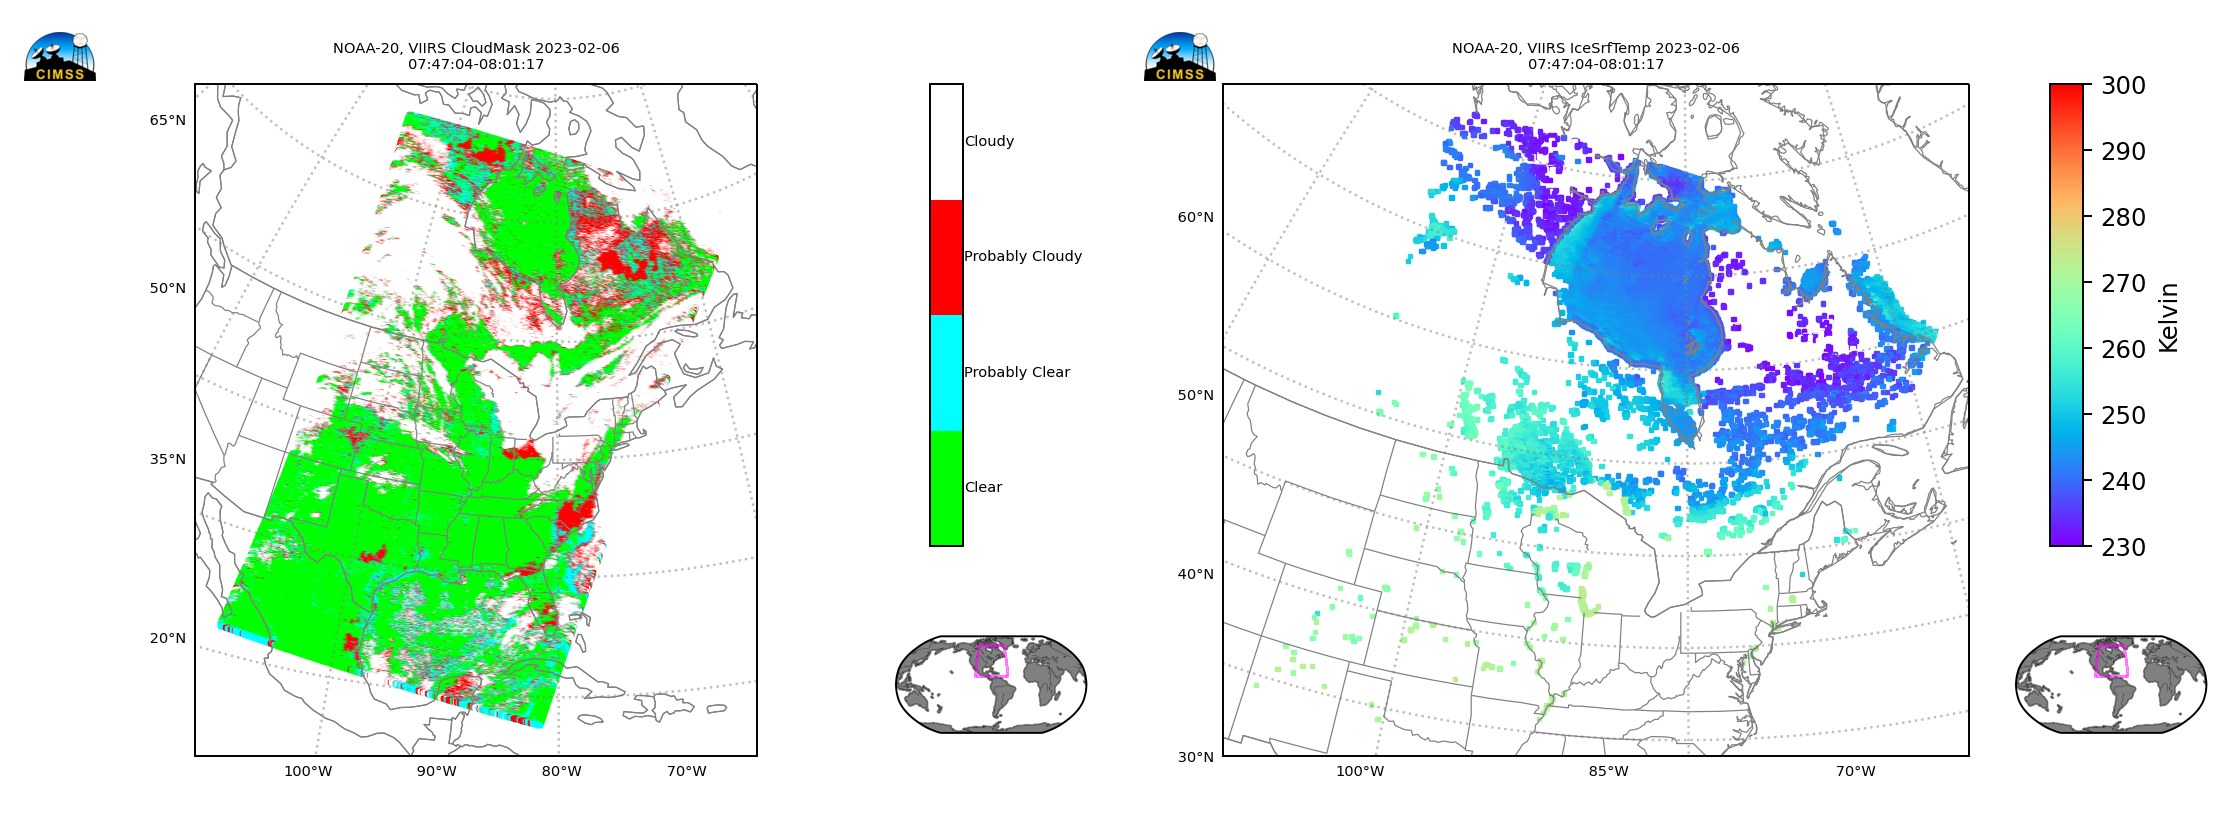
Products created from VIIRS and ATMS imagery on board NOAA-20 also show the curious ice difference over western Hudson Bay, For example, the Ice Surface Temperature, shown below with the VIIRS cloud mask, shows warmer ice surface temperatures over western Hudson Bay.
Microwave imagery from the Advanced Technology Microwave Sounder (ATMS) at the same time (for window channels) also shows warmer brightness temperatures over western Hudson Bay. An interesting question is why — and why do these brightness temperatures also mean less reflectance?

Visible (daytime) imagery from the previous day from the 1746 UTC NOAA-20 (from here) overpass hints at a possible reason. The 1.61 µm imagery over the western part of the Hudson Bay is a bit darker — suggestive of less reflectance either because of snow age, or because of past freezing rain/ice pellet accumulation. The difference apparent in the Day Night band is also apparent in the VIIRS Day time visible imagery toggling below (and here). The difference in the surface inferred by the changes in the 1.61 µm imagery would affect the emission of infrared imagery on the following night, leading to the differences in brightness temperatures observed.
Brad Vrolijk, a forecaster in eastern Canada, notes via email that a more plausible explanation is persistent northwesterly winds in the region. The animation of 0900 UTC surface analyses (from 24 January to 6 February) below does show a surface pressure analysis consistent with northwesterly winds around persistent Low Pressure over that would result in a scouring of snow from the western part of the bay, and that would affect the reflectance.

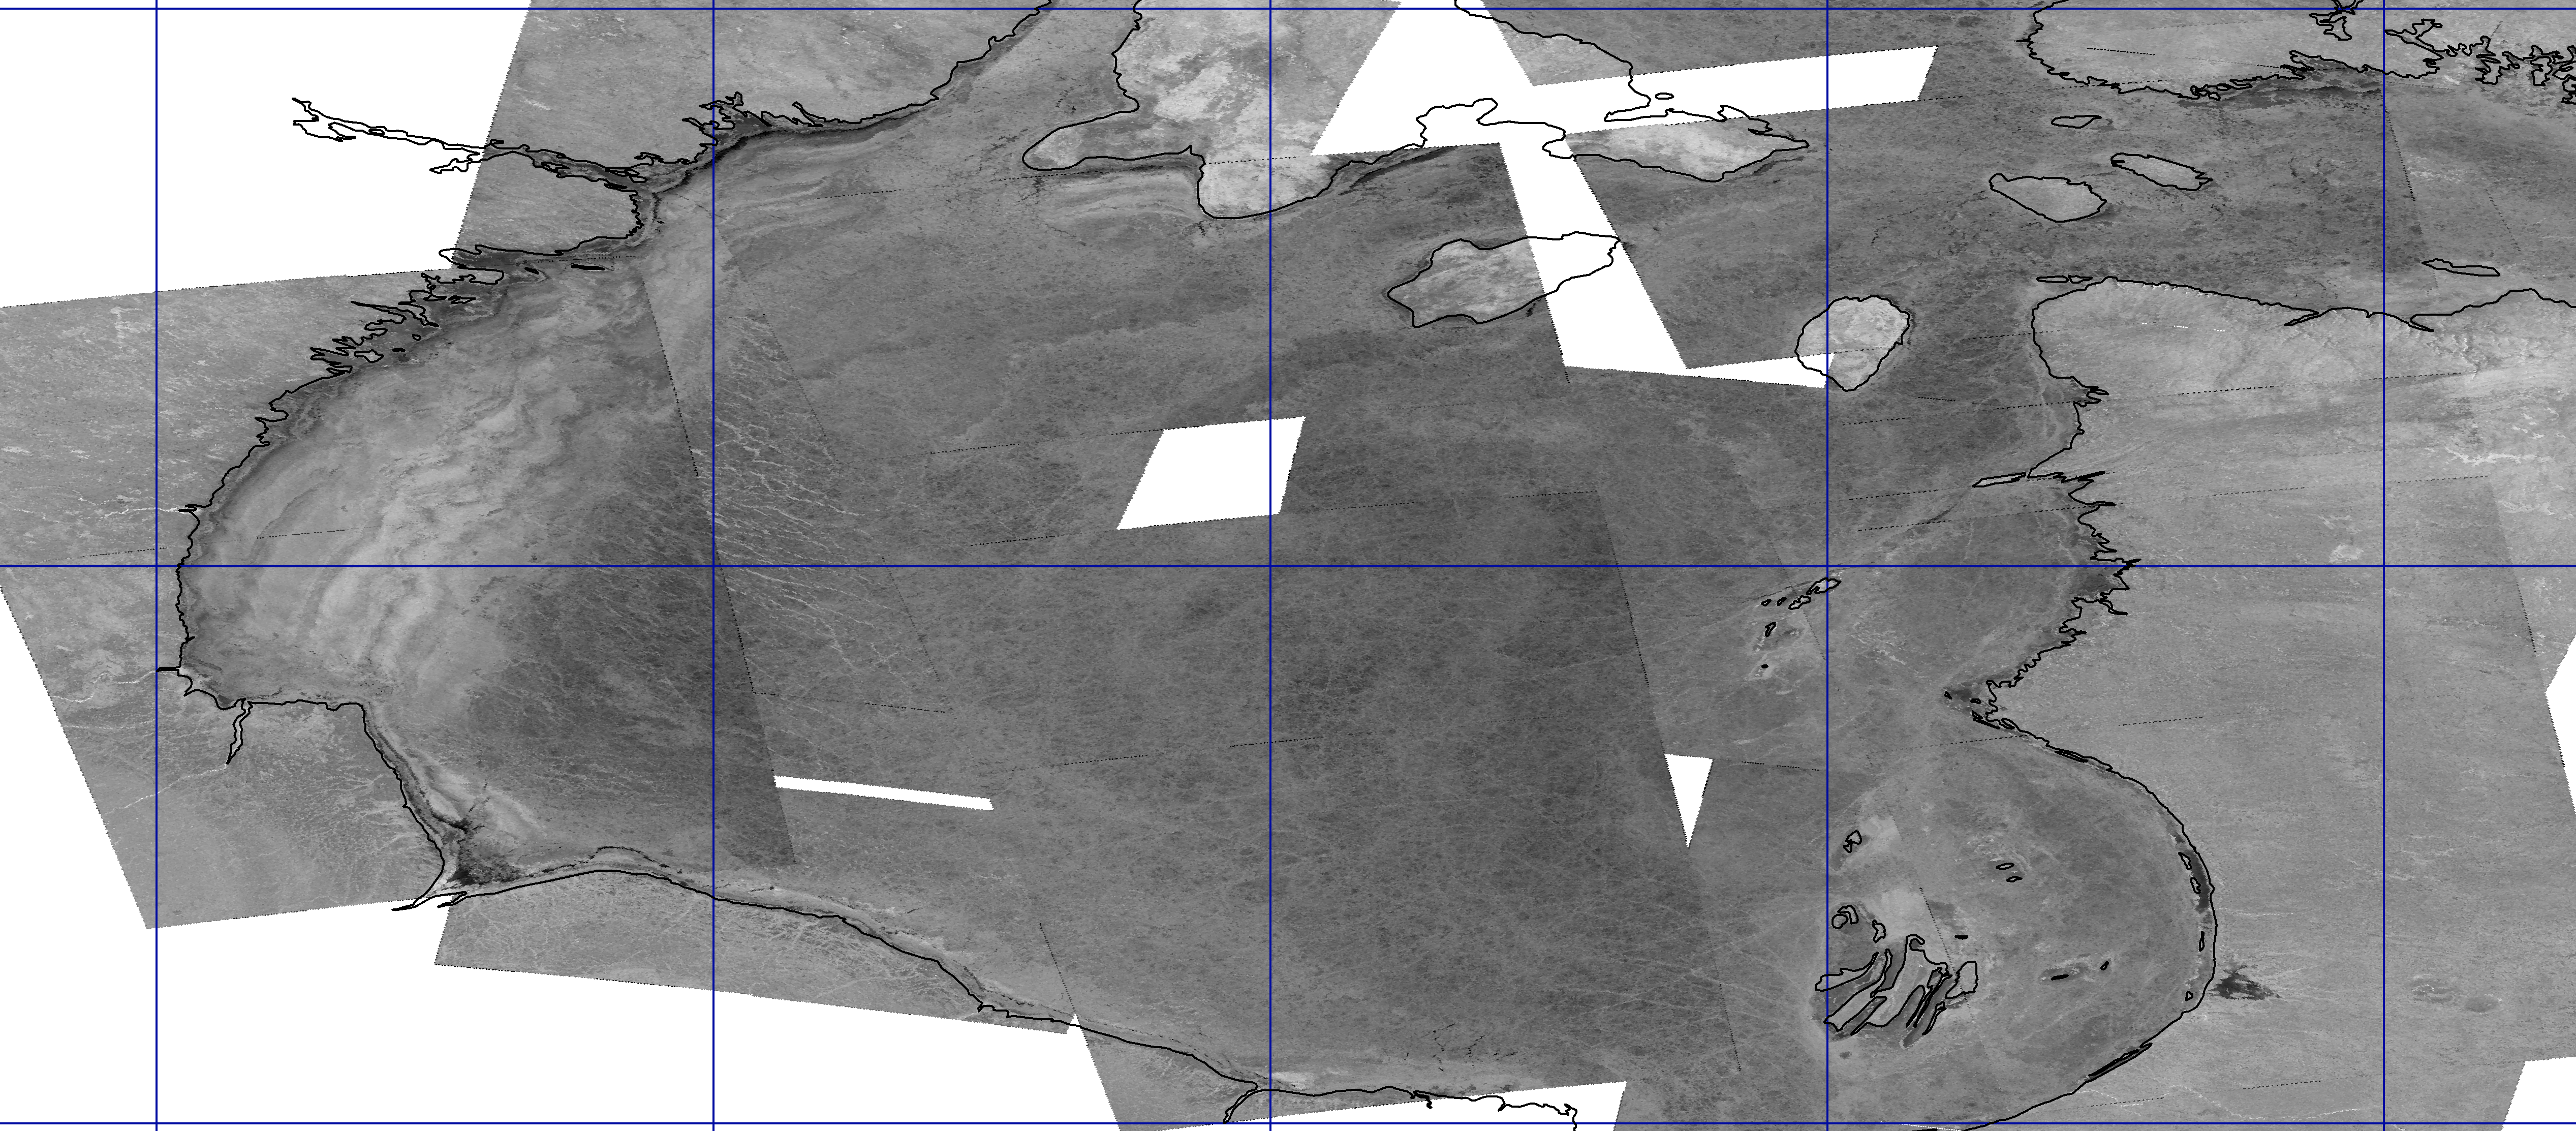
The NOAA/STAR Water Surface Conditions / Synthetic Aperture Radar (WSC/SAR) Team sent the following composite SAR Ice image over Hudson Bay (Thanks!!): the brighter region over western Hudson Bay shows rougher ice there.
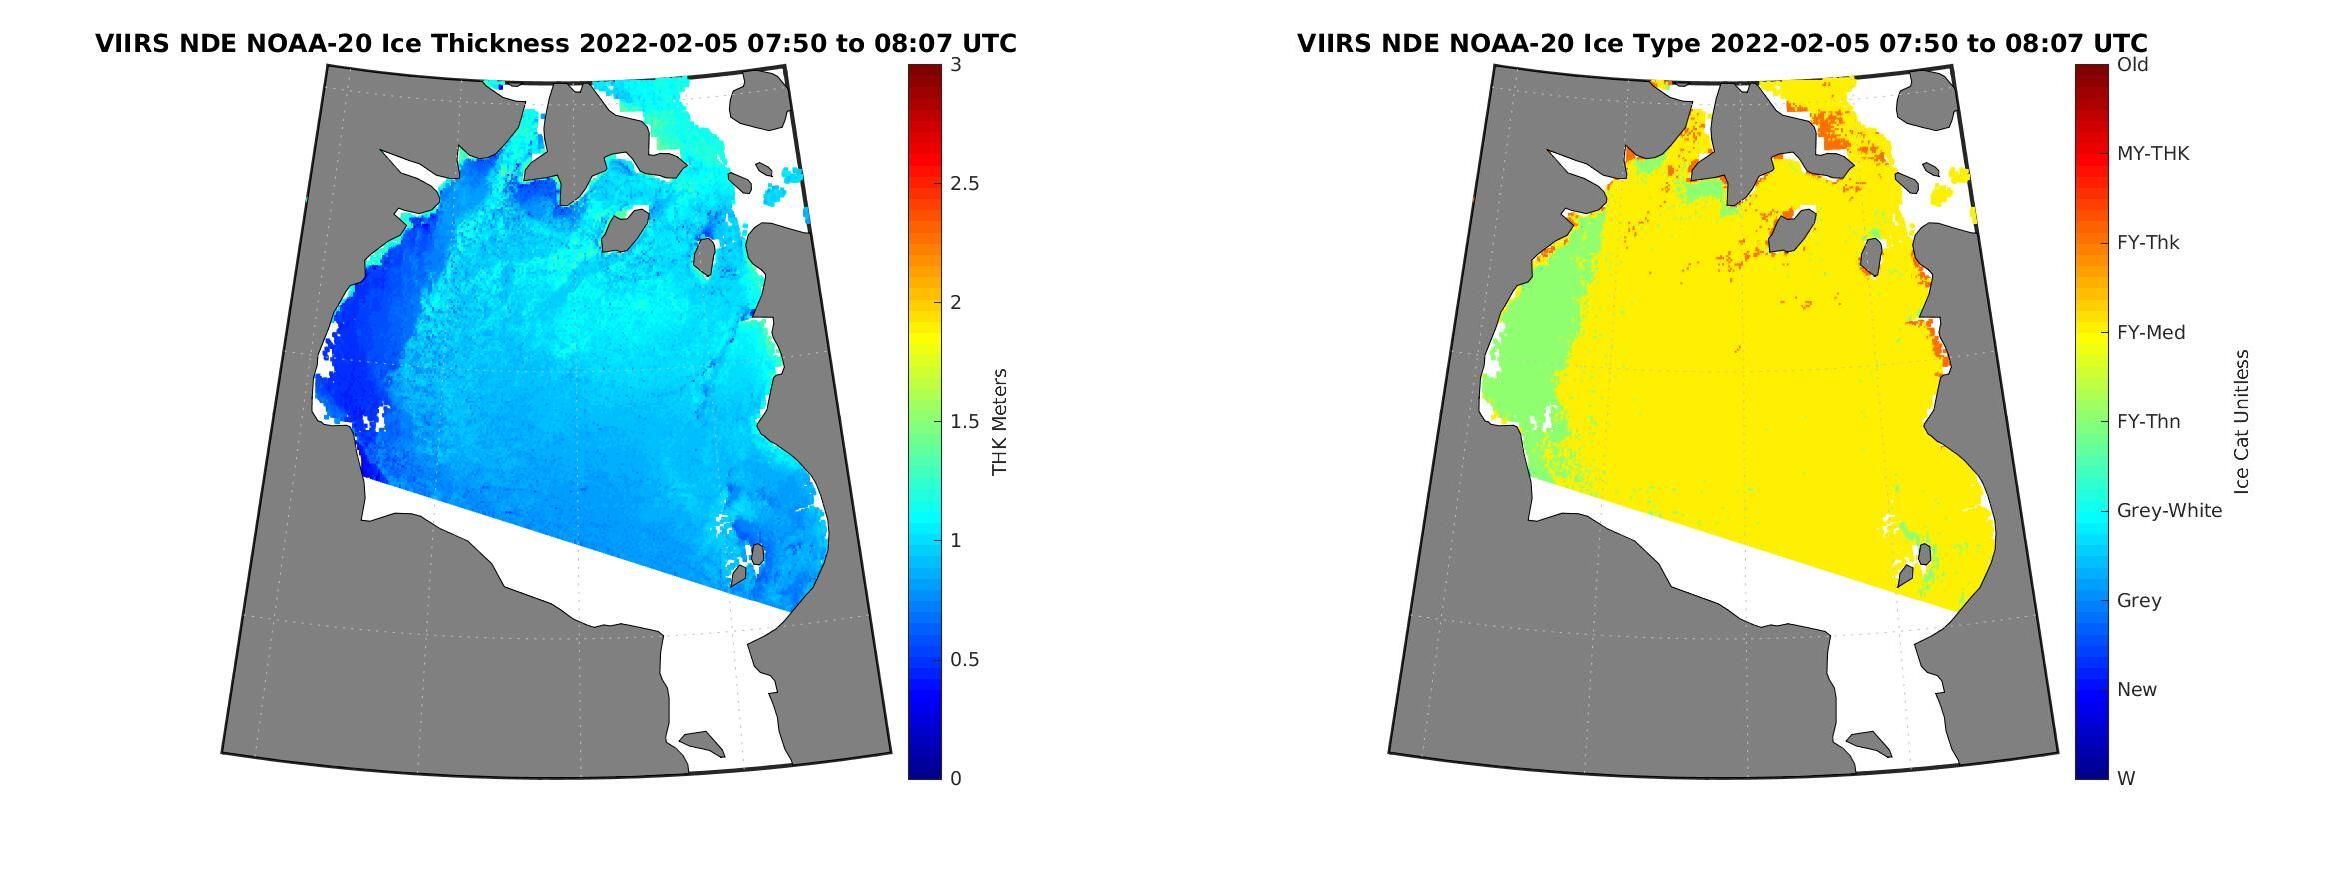
VIIRS ice products also include Sea Ice Thickness and Sea Ice Age, as shown below from 5 February. Note that these two products are controlled in part by the Ice Surface Temperature, shown above. The darker ice over western Hudson Bay is both thinner (dark blue v. cyan to the east) and younger (green v. yellow to the east). (Images courtesy Rich Dworak, CIMSS).
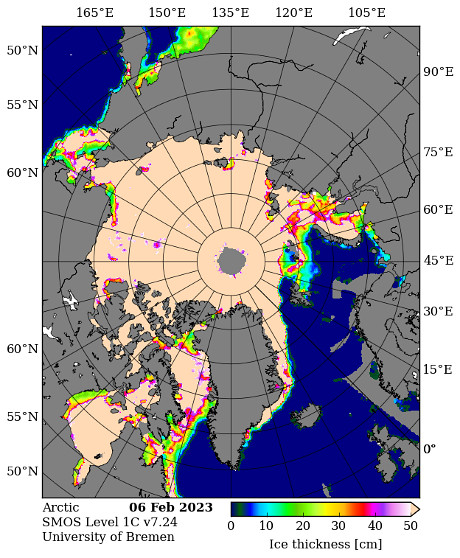
SMOS satellite observations of sea ice thickness also show thinner ice over western Hudson Bay. The image below is taken from this website.
Added, March 2023: The National Sea Ice Data Center (NSIDC) had a news article on this feature (link) as part of a discussion on the Kivalliq polynya.