Atmospheric River affecting Alaska
MIMIC Total Precipitable Water fields for the 24 hours ending 1700 UTC on 21 January, above, show abundant moisture flowing into southern Alaska. Hourly GOES-17 infrared imagery (Band 13 clean window infrared imagery at 10.3 µm), below, shows a large cyclonic circulation to the south and west of Alaska that is helping to draw moisture towards the state. Level 2 Total Precipitable Water (TPW) is overlain on the imagery and two things stand out: because it is a clear-sky only product, and because the north Pacific Ocean is very cloudy on the 21st, there is little TPW information. Also, GOES-R Total Precipitable Water is not completely Full Disk; TPW is computed to a Local Zenith Angle of 67o (ATBD) and you can see the cut-off for the product in northwestern Canada. Those two things argue for the utility of microwave detection of moisture over Alaska, as shown above.
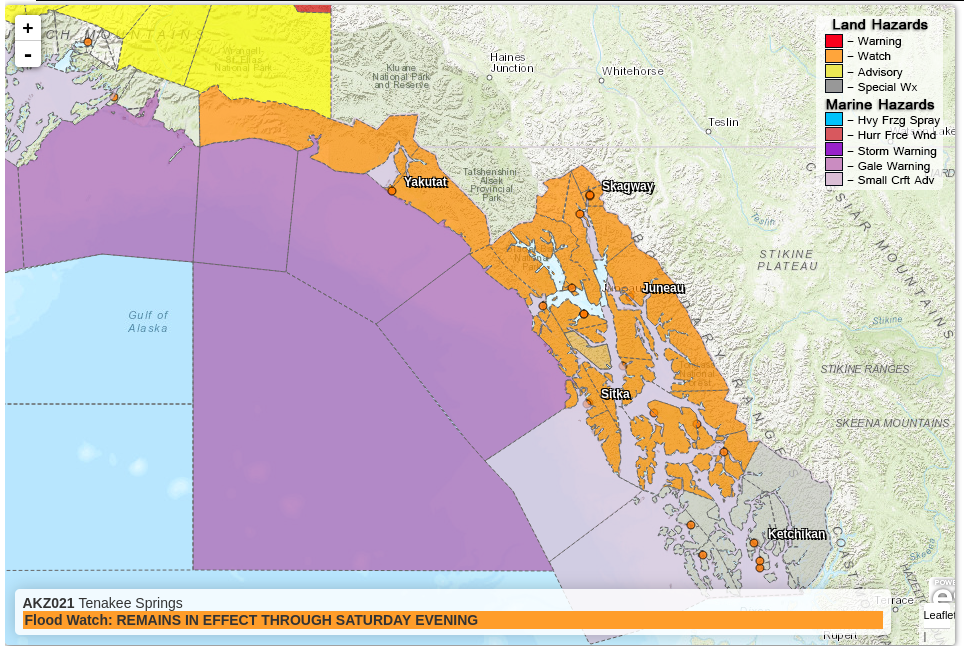
Much of Alaska Southeast from Yakutat to Wrangell is under a Flood Watch. (Image, taken from this site)