Hail damage to Delta Flight 1889 over Nebraska
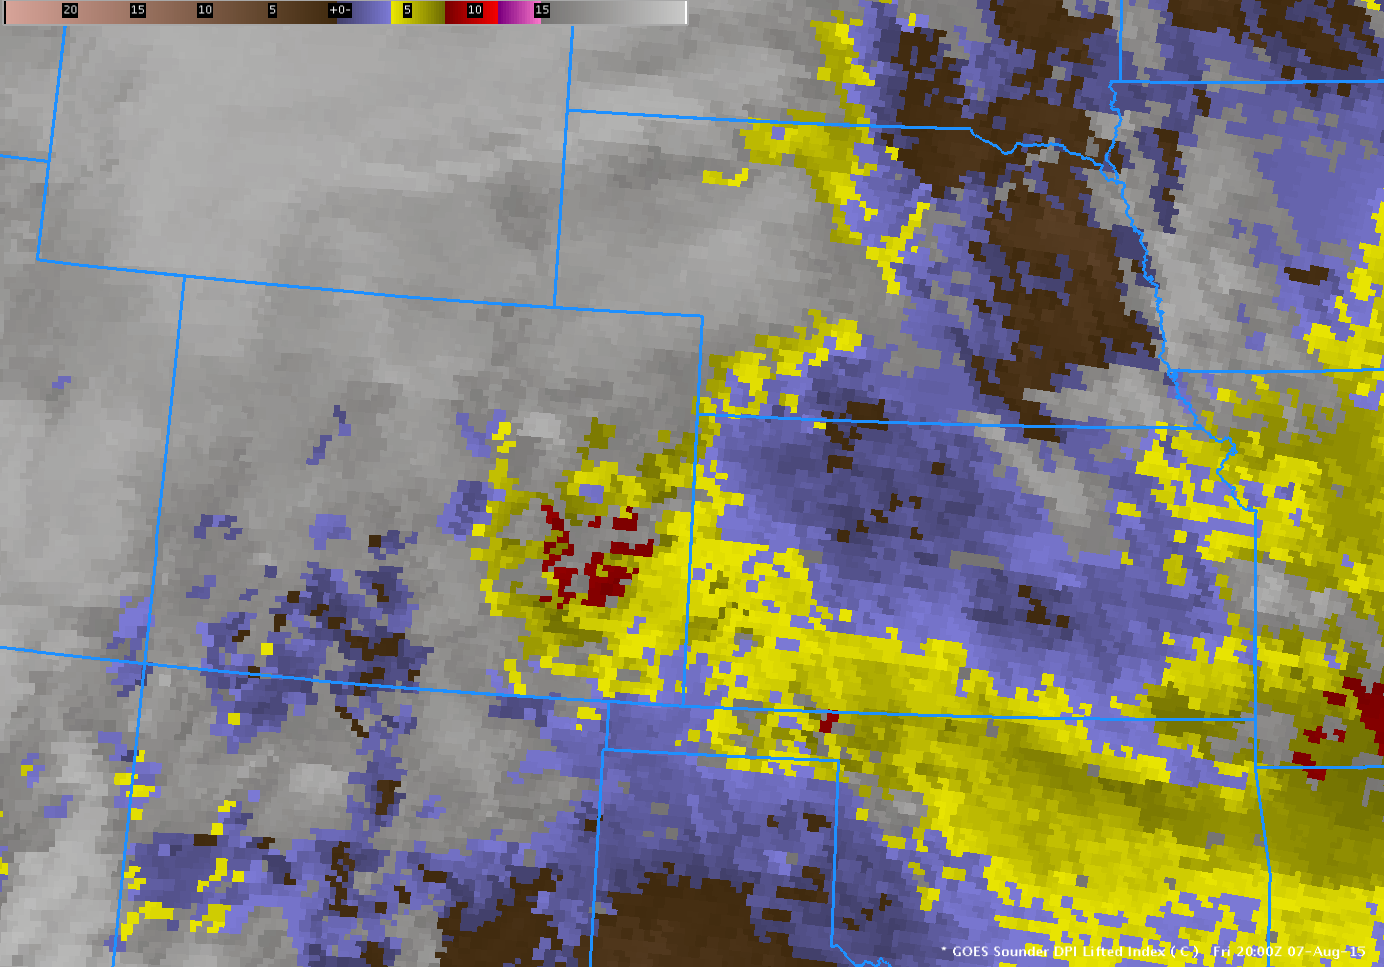
![GOES-13 Sounder Lifted Indices [click to play animation]](https://cimss.ssec.wisc.edu/satellite-blog/wp-content/uploads/sites/5/2015/08/GOESSounderDPI_LI_07August201512z_08August201502zanim.gif)
GOES-13 Sounder Lifted Indices [click to play animation]
![GOES Sounder Convective Available Potential Energy (CAPE), 1600 - 2000 UTC 7 August 2015 [click to enlarge]](https://cimss.ssec.wisc.edu/satellite-blog/wp-content/uploads/sites/5/2015/08/GOESSounderCAPE.15219.1600.1800.2000toggle.gif)
GOES Sounder Convective Available Potential Energy (CAPE), 1600 – 2000 UTC 7 August 2015 [click to enlarge]
![GOES-13 LAP estimates of Lifted Index (LI) and Convective Available Potential Energy (CAPE), 1600 UTC 7 August 2015 [click to enlarge]](https://cimss.ssec.wisc.edu/satellite-blog/wp-content/uploads/sites/5/2015/08/LAPS_LI_CAPEGOESRP1_20150807_16Ztoggle.gif)
GOES-13 LAP estimates of Lifted Index (LI) and Convective Available Potential Energy (CAPE), 1600 UTC 7 August 2015 [click to enlarge]
![GOES-13 Visible imagery (0.63 µm) 1900 UTC 7 August - 0145 UTC 8 August [click to animate]](https://cimss.ssec.wisc.edu/satellite-blog/wp-content/uploads/sites/5/2015/08/GOES13_7August2015_1900_8August_0145anim.gif)
GOES-13 Visible imagery (0.63 µm) 1900 UTC 7 August – 0145 UTC 8 August [click to animate]
![GOES-13 Visible imagery (0.63 µm) 0045 UTC 8 August - 0130 UTC 8 August [click to animate]](https://cimss.ssec.wisc.edu/satellite-blog/wp-content/uploads/sites/5/2015/08/GOES13_8August2015_0045_0130anim.gif)
GOES-13 Visible imagery (0.63 µm) 0045 UTC 7 August – 0130 UTC 8 August [click to animate]
![GOES-15 Visible imagery (0.63 µm) 1900 UTC 7 August - 0145 UTC 8 August [click to animate]](https://cimss.ssec.wisc.edu/satellite-blog/wp-content/uploads/sites/5/2015/08/GOES15_7August2015_1900_8August_0145anim.gif)
GOES-15 Visible imagery (0.63 µm) 1900 UTC 7 August – 0145 UTC 8 August [click to animate]
![GOES-15 Visible imagery (0.62 µm) 1900 UTC 7 August - 0145 UTC 8 August [click to enlarge]](https://cimss.ssec.wisc.edu/satellite-blog/wp-content/uploads/sites/5/2015/08/GOES15_8August2015_0000_0145anim.gif)
GOES-15 Visible imagery (0.62 µm) 0000 UTC 8 August – 0145 UTC 8 August [click to enlarge]
![GOES-13 Infrared imagery (10.7 µm) 0015 UTC 8 August - 0215 UTC 8 August [click to animate]](https://cimss.ssec.wisc.edu/satellite-blog/wp-content/uploads/sites/5/2015/08/GOES13_IR4_08AUGUST_0015_0215anim.gif)
GOES-13 Infrared imagery (10.7 µm) 0015 UTC 8 August – 0215 UTC 8 August [click to animate]
![Rocking animation of GOES-13 Infrared imagery (10.7 µm) 0015 UTC 8 August - 0215 UTC 8 August [click to enlarge]](https://cimss.ssec.wisc.edu/satellite-blog/wp-content/uploads/sites/5/2015/08/GOES13_IR4_08AUGUST_0015_0215rock.gif)
Rocking animation of GOES-13 Infrared imagery (10.7 µm) 0015 UTC 8 August – 0215 UTC 8 August [click to enlarge]
![GOES-15 (left) and GOES-13 (right) 10.7 µm Infrared images [click to play animation]](https://cimss.ssec.wisc.edu/satellite-blog/wp-content/uploads/sites/5/2015/08/150807_goes15_goes13_ir_Delta1889_anim.gif)
GOES-15 (left) and GOES-13 (right) 10.7 µm Infrared images [click to play animation]
![GOES-15 (left) and GOES-13 (right) 0.63 µm Visible images [click to play animation]](https://cimss.ssec.wisc.edu/satellite-blog/wp-content/uploads/sites/5/2015/08/150807_goes15_goes13_visible_Delta1889_anim.gif)
GOES-15 (left) and GOES-13 (right) 0.63 µm Visible images [click to play animation]
The flight positions of Delta 1889 are superimposed on a composite animation of GOES-13 Infrared (10.7 µm)and Goodland, Kansas radar reflectivity, below (courtesy of Rick Kohrs, SSEC).
![Delta Flight 1889 position, GOES-13 Infrared images, and Goodland, Kansas radar reflectivity [click to play QuickTime movie]](https://cimss.ssec.wisc.edu/satellite-blog/wp-content/uploads/sites/5/2015/08/Delta1889_goes13_ir_gld_radar.png)
Delta Flight 1889 position, GOES-13 Infrared images, and Goodland, Kansas radar reflectivity [click to play QuickTime movie]