Comments, questions on this web page? Send e-mail to: |
Accomplishments in FY03HES trade-off studies (spectral coverage, spectral resolution, spatial resolution and signal-to-noise) HES trade-off studies (spectral coverage, spectral resolution, spatial resolution and signal-to-noise)The objective is to find optimal balance among spectral coverage, spectral resolution, spatial resolution, signal-to-noise, etc. based on the users' requirement and technical requirement.Simulation study for local zenith angle = 0, 62.5, 65, and 70, respectively
Local zenith angle impact on retrieval is important because this will help to determine the position of the GOES-R and beyond in the space. The simulation study has been carried out for local zenith angle = 0, 62.5, 65, and 70, respectively (see Figure 1). The difference between 62.5 and 65 degrees is small. A large local zenith angle results in more of degradation on the water vapor retrieval while it has less impact on the temperature retrieval. Physically it makes sense because large local zenith angle will make water vapor (more absorption in radiances) retrieval more nonlinear and unstable. A nonlinear physical retrieval algorithm should reduce the angle effects. Re-visit water vapor information from LMW versus SMW
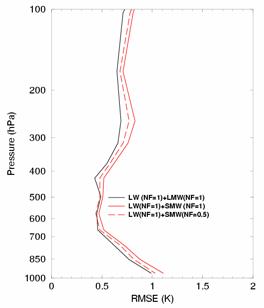
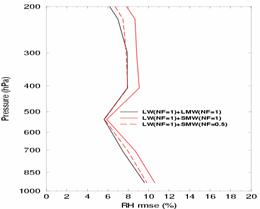
One important issue for HES instrument design is to select water vapor spectral coverage. Usually longwave coverage (LW, approximately 650 - 1200cm-1) is selected for temperature, ozone and surface property retrievals. For the water vapor region, one can use either longer middlewave (LMW, approximately 1200 - 1650cm-1) or shorter middlewave (SMW, approximately 1650 - 2250cm-1). AIRS, for example, uses LMW while Geosynchronous Imaging Fourier Transform Spectrometer (GIFTS) uses SMW. Selection of both water vapor sides might be a better option in terms of information. For example, having both sides of the water vapor continuum would allow better trace gas measurements, and improved ABI back-up mode, better continuity for climate applications and improved retrievals. However, data volume will be increased. In order to compare the water vapor information from LMW versus SMW, a simulation study was carried out to simulate the retrieval performance for HES LW + LMW versus LW + SMW. Eigenvector regression followed by physical retrieval algorithm was used in the simulation (Li et al. 2003a); the spectral resolution for all spectral band channels is 0.625 cm-1 523 global independent profiles were used in retrieval performance study, and 1 km temperature root mean square error (rmse) and 2 km relative humidity (RH) rmse were calculated to evaluate the retrieval difference between LW + LMW and LW + SMW. The 14bit HES instrument noise from the Technical Requirement Document (TRD) was used in simulating the HES radiances. Figure 15 shows an example of HES BT spectrum for LW (blue line), LMW (green line) and SMW (red line) (upper panel), the HES instrument noise in NEDR for LW, LMW and SMW is also shown in the lower panel. Figure 3 shows temperature retrieval rmse at 1km vertical resolution for LW + LMW, LW + SMW, and LW + SMW with SMW noise reduced by half (NF=0.5) (left panel), and the water vapor RH retrieval rmse at 2km vertical resolution (right panel). In general, the temperature retrieval difference between LW+LMW and LW+SMW is about 0.1K, while the water vapor retrieval difference is about 1%. With SMW noise reduced by half, both temperature and water vapor retrieval differences between LW+LMW and LW+SMW are reduced. Considering other factors for LMW (for example, lower spectral resolution than SMW, more trace gas other than water vapor, etc.), the temperature and moisture retrieval differences between LW + LMW and LW + SMW are very small. Spatial resolution study using MODIS 1km data
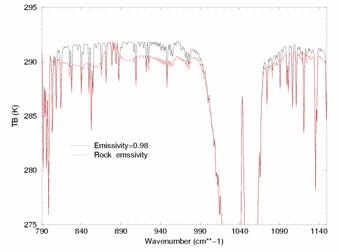
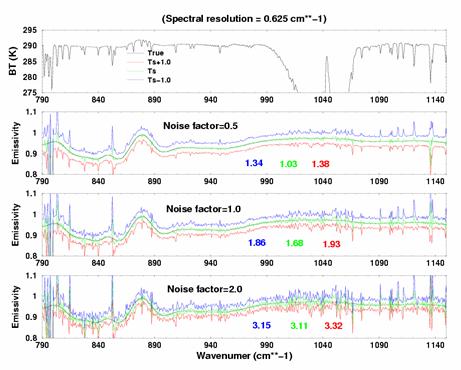
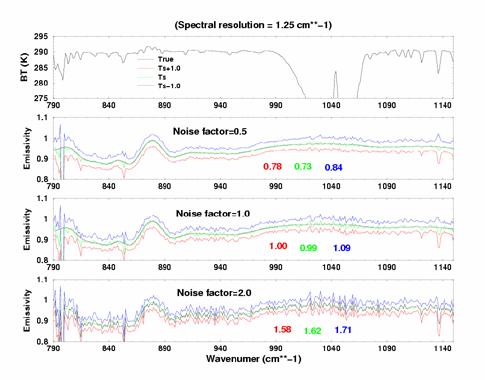
The spatial resolution for HES is very important because "hole hunting" will be the effective method to find clear pixels for atmospheric sounding without microwave sounding capability on the geostationay satellite. Fine spatial resolution allows a higher possibility of finding clear pixels and maintaining spatial gradients. This is very important because (a) fine spatial resolution HES measurements will meet the mesoscale forecast requirement, and (b) fine spatial resolution enable to find more homogeneous 2 by 2 or 3 by 3 fields-of-view (FOV) scenes for the possible cloud-clearing process with ABI/HES synergism, Figure 4 shows the 1km MODIS TPW at 1900UTC on July 20, 2002 from EOS' AQUA satellite, and a number of reduced spatial resolutions for IR sounders. It can be seen that coarser spatial resolution results in smoothed TPW gradients and less clear coverage. The spatial resolution of 2km or better for ABI and km or better for HES-DS should be considered. Spectral resolution study for non-soundingIn order to help define the requirement for HES spectral coverage and spectral resolution, trade-off studies are necessary to investigate the impact of long-wave IR window spectral resolution on non-sounding products. A study has been carried to demonstrate that in the IR longwave window region, a spectral resolution of 1cm-1 or better is necessary for accurately retrieving the non-sounding products such as IR surface emissivity and surface skin temperature by using the minimum local emissivity variance (MLEV) algorithm. Figure 5 shows the calculated LW BT spectrum at 0.625cm-1 with two different IR surface emissivity spectra (one is from the constant emissivity of 0.98 and the other is from an observed rock emissivity spectrum). The BT difference between the two spectrum in the figure results solely from the different emissivity spectrum in the calculations. Figure 6 shows from upper to lower panels the BT spectrum with rock emissivity, true emissivity spectrum (black line), retrieved emissivity spectra with true surface skin temperature (green line) and surface skin temperature deviated by 1K (green and red lines). The noise factor indicates the noise added in the simulation (e.g., 0.5 means half noise). The mean local emissivity variance is also indicated in each panel. Both half noise and nominal noise will create emissivity variance contrasts between true skin temperature and wrong skin temperature, indicating that both surface skin temperature and IR emissivity spectrum can be retrieved. However, the emissivity variance contrasts are very small with doubled noise, indicating that the skin temperature and surface emissivity retrieval will be difficult with doubled noise. The spectral resolution in the figure is 0.625 cm-1. Figure 7 is the same as Figure 6 but with a spectral resolution of 1.25 cm-1, in this case, only half noise will create good emissivity variance contrasts in a lower spectral resolution.
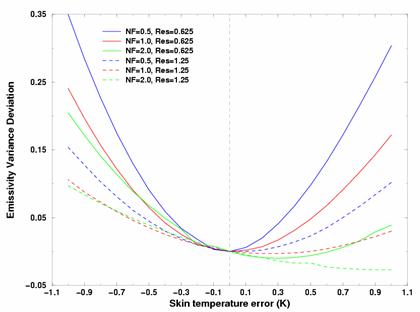
Figure 8 shows the emissivity variance differences between the
wrong skin temperature and the true skin temperature as a function
of skin temperature error, different lines correspond to various
spectral resolutions and noise factors. It clearly indicates that
a spectral resolution of 0.625 cm-1 with half noise and nominal
noise will create an accurate emissivity and skin temperature retrievals,
while only half noise will create good surface property retrieval
with lower spectral resolution (e.g., 1.25 cm-1). Note that this
effect is not the only error source in estimating surface emissivity
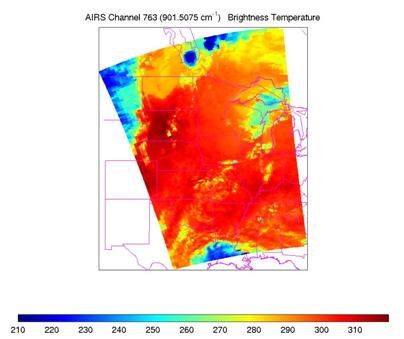
and skin temperature. HES sub-pixel cloud characterization using ABI dataThe ABI will provide better information on cloud mask, cloud types and phase with high spatial resolution, while the HES will provide profile, cloud-top height, emissivity, water and ice content with better accuracy but with poorer spatial resolution. The combination of data from both sensors will provide better atmospheric parameter and cloud property retrievals than that from either sensor alone. The fundamental step of synergistic use of ABI/HES is the HES sub-pixel cloud characterization (Li et al. 2003c). Studies on HES sub-pixel cloud characterization using ABI data include: 1) the collocation (in space and time) between imager products and sounder radiance measurements, and 2) the sounder sub-pixel cloud type classification as well as the cloud phase determination using imager multi-spectral measurements with high spatial resolution. The MODIS and AIRS measurements from the EOS Aqua satellite have been used to research the HES sub-pixel cloud characterization using ABI imager.Figure 9 shows the AIRS BT image of channel 763 (901.51cm-1) at
1917UTC (AIRS granule number 193) on 6 September 2002. Clouds
are indicated by the blue colors. A study area (indicated
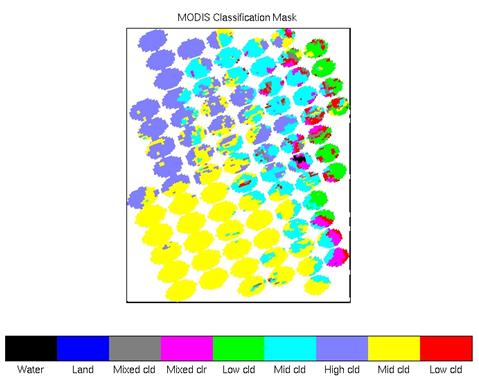
in Figure 9) is selected for sub-pixel cloud characterization study. Figure
10 shows the study area (see Figure 9) of the cloud classification
mask at 1km spatial resolution shading to the AIRS footprints.
Different layers of clouds within AIRS footprints are well identified
by the MODIS cloud classification mask. Some AIRS footprints
contain single layer clouds, while some contain multi-layer clouds
according to the MODIS 1km classification mask. This sounder sub-pixel
cloud characterization using imager data is the first step for
retrieving the atmospheric parameters and cloud properties by synergistically
using the ABI and HES data.
ABI/HES synergismABI products such as atmospheric temperature/moisture profiles and cloud properties can serve as background information, the atmospheric and cloud parameters can be retrieved from sounder radiances with much better accuracy, this is demonstrated by cloud property retrieval from synergistically using MODIS/AIRS data. The variational (1DVAR) algorithm (Li et al. 2001) is used in ABI/HES synergistic retrieval. Preliminary results are shown to demonstrate the concept and advantage of ABI/HES synergism.
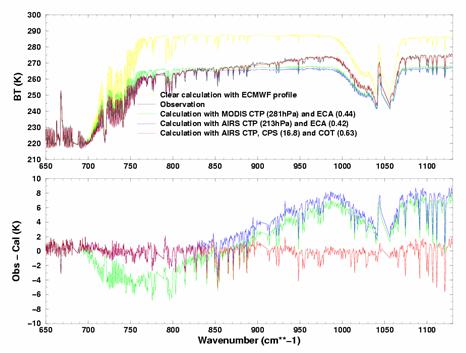
The AIRS footprint indicated by an arrow in Figure 10 is used to demonstrate the MODIS/AIRS synergistic cloud retrieval. This pixel is identified by MODIS classification mask as middle level clouds and the clouds belong to ice clouds according to the MODIS cloud phase mask at 1km resolution. The upper panel of Figure 11 shows the AIRS longwave clear BT calculation from the ECMWF forecast model analysis (yellow line), the cloudy BT calculation with the MODIS CTP and ECA (green line), the BT calculation from the AIRS retrieved CTP and ECA, and the BT calculation with AIRS retrieved CTP as well as cloud particle size (CPS) and cloud optical thickness (COT) (redline), along with the cloudy BT observation (black line) spectra for footprint indicated by an arrow in Figure 10; the lower panel of Figure 11 shows the corresponding BT difference between observation and calculation. As described, the MODIS cloud products serves as the background information in the AIRS retrieval; a variational (1DVAR) approach is used for MODIS/AIRS synergistic retrieval of CTP, ECA, CPS and COT products (Li et al. 2003d). It shows that there is a large difference between calculation with the MODIS cloud products and observation in the CO2 region, the difference in the CO2 region is almost removed by the calculation with the AIRS retrieved CPT and ECA; AIRS adjusted the MODIS CTP by 68 hPa. However, the slope of the BT in the spectral window region for the AIRS footprint is still significantly large because of CPS effects. With AIRS retrieved CPS and COT for this footprint, the calculation (red line in this figure) fits the slope very well, indicating that the cloud microphysical properties can be retrieved effectively by the AIRS radiance measurements (Li et al. 2003d). Cube studiesIn order to demonstrate the capability of high temporal resolution HES on monitoring the evolution of weather system. The atmospheric cube data from MM5 during International H2O Project (IHOP) in 2002 experiments has been used for the simulation study. The time step for the successive cube data is half hour, temperature and moisture regression retrievals (currently no physical retrieval in this cube study) are created from simulated HES clear radiances with noise added, retrieval fields are compared with true atmospheric fields from the cubes to demonstrate the spatial and temporal characteristics of HES radiances and sounding retrievals.
Figure 12 shows the true (left panel) and HES retrieved (right panel) 850hPa water vapor mixing ratio from MM5 at 4km spatial resolution at 1800UTC on 12 June 2002. The HES 2-band FTS approach is used in this simulation. ReferencesLi, J., T. J. Schmit, F. Sun and W. P., Menzel, 2003a: Surface and atmospheric retrievals from the future GOES Sounder-Advanced Baseline Sounder (ABS). Conference on Satellite Meteorology and Oceanography, 12th, Long Beach, CA, 9-13 February (preprints). Boston, MA, American Meteorological Society (AMS), P5.5.Li, J., W. P. Menzel, Z. Yang, R. A. Frey, and S. A. Ackerman, 2003b: High spatial resolution surface and cloud type classification from MODIS multi-spectral band measurements , J. Appl. Meteorol.,42, 204 - 226. Li, J., W. P. Menzel, F. Sun, T. J. Schmit, and J. Gurka, 2003c: AIRS sub-pixel cloud characterization using MODIS cloud products, J. Appl. Meteorol. (submitted) Li, J., W. P. Menzel, W. Zhang, F. Sun, T. J. Schmit, J. Gurka, and E. Weisz, 2003d: Synergistic use of MODIS and AIRS in a variational retrieval of cloud parameters, J. Appl. Meteorol, (submitted). Li, J., F. Sun, T. J. Schmit, W. P. Menzel, and J. J. Gurka, 2004: Study of HES on GOES-R and beyond, Proceeding of 20th International Conference on Interactive Information and Processing System (IIPS) for Meteorology, Oceanography, and Hydrology, American Meteorological Society, Jan. - 14, 2004, Seattle, WA, AMS. Li, J., T. J. Schmit, and W. P. Menzel, 2002: Advanced Baseline Ssounder (ABS) for future Geostationary Operational Environmental Satellites (GOES-R and beyond), SPIE proceeding, Applications with Weather Satellites, Oct.23 - 27, 2002, Hangzhou, China. Li, J., Menzel, W. P., and A. J. Schreiner, 2001: Variational retrieval of cloud parameters from GOES sounder longwave cloudy radiance measurements. J. Appl. Meteorol. 40, 312-330. Li, J., T. J. Schmit, H. L. Huang, and H. M. Woolf, 2001: Retrieval of atmospheric inversions using geostationary high-spectral-resolution sounder radiance information. 11th Conference on Satellite Meteorology and Oceanography, 15 - 18 October 2001, Madison, WI. Gurka J. J., and G. J. Dittberner, 2001: The next generation GOES instruments: status and potential impact". Preprint Volume. 5th Symposium on Integrated Observing Systems. 14-18 January, 2001, Albuquerque, NM., Amer. Meteor. Soc., Boston. Gurka, J. J, and T. J. Schmit, 2002: Recommendations on the GOES-R series from GOES users' conferences, SPIE Proceeding 4895, 95 - 2. Schmit, T. J., et al., 2004: Study of ABI on GOES-R and beyond, Proceeding of 20th International Conference on Interactive Information and Processing System (IIPS) for Meteorology, Oceanography, and Hydrology, American Meteorological Society, Jan. - 14, 2004, Seattle, WA, AMS. Schmit, T. J., J. Li, W. P. Menzel, 2002: ABI for future GOES-R and beyond, SPIE Proceeding 4895, 111-122. Seemann, S. W., Li, J., W. P. Menzel, and L. Gumley, 2002. Operational
retrieval of atmospheric temperature, moisture, and ozone from
MODIS, J. Appl. Meteor. 42: 72 - 91. |
||||||||||||||||||||||||||||||||