Some volcanoes erupt violently with explosive power spewing clouds of volcanic ash, cinders, and large rocks. Other volcanoes are relatively quiet and erupt gently, releasing molten rock onto the Earth’s surface called lava. Differences are due to the amount of dissolved gases in the magma (molten rock below the Earth's surface) and how easily those gases can escape into the atmosphere. The more viscous the magma and the more gas it contains, the more violent the eruption will be!
Thus, depending on the composition and viscosity of the magma, different landforms result. The major types of volcanic landforms include: flood basalts, shield volcanoes, cinder cones (also called scoria cones), stratovolcanoes (also called composite cones), lava domes, and calderas.
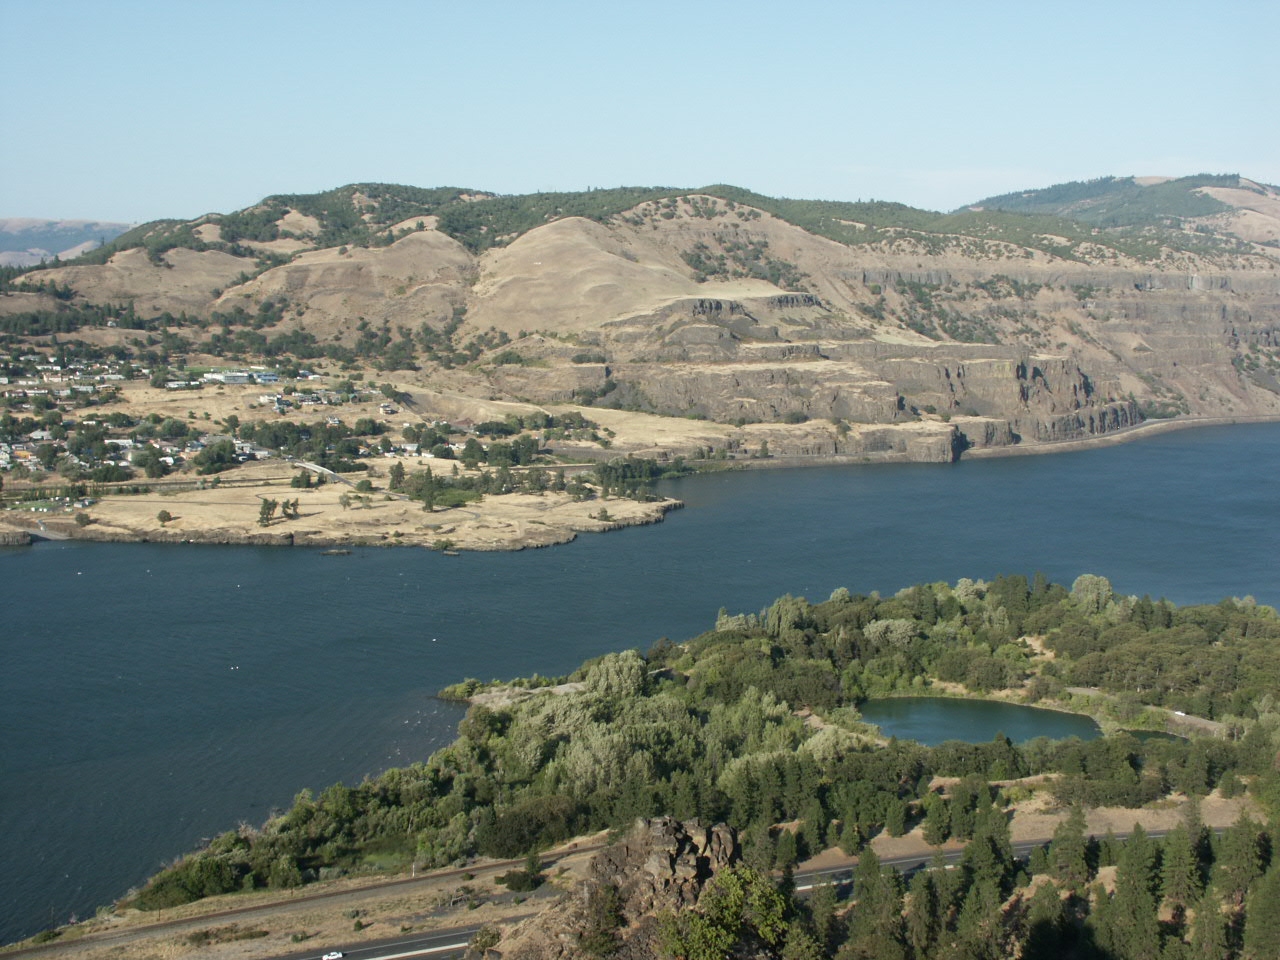
Figure 1: Thick sequence of thin basaltic lava flows have built up this flat plateau along the Columbia River between Oregon and Washington states.
(Click to enlarge)
Flood Basalts (Figure 1) generally have very gentle eruptions, where large volumes of low-viscosity and low-gas magmas erupt from fissures (cracks) to build up broad, nearly flat plateaus. Flood basalts can erupt on continents or on the ocean floor. The dark areas on the Moon (maria) are extensive examples of flood basalts. Examples on Earth include: the Laki flow in Iceland and the Columbia Plateau in the Pacific Northwest.
Shield Volcanoes (Figure 2) also result from gentle eruptions of low viscosity basaltic magma. The low viscosity of the lava makes it easy to flow, and therefore difficult to build up steep sides. Shield volcanoes are typically enormous (much larger than any stratovolcano) - the big island of Hawaii, the largest volcano on Earth.
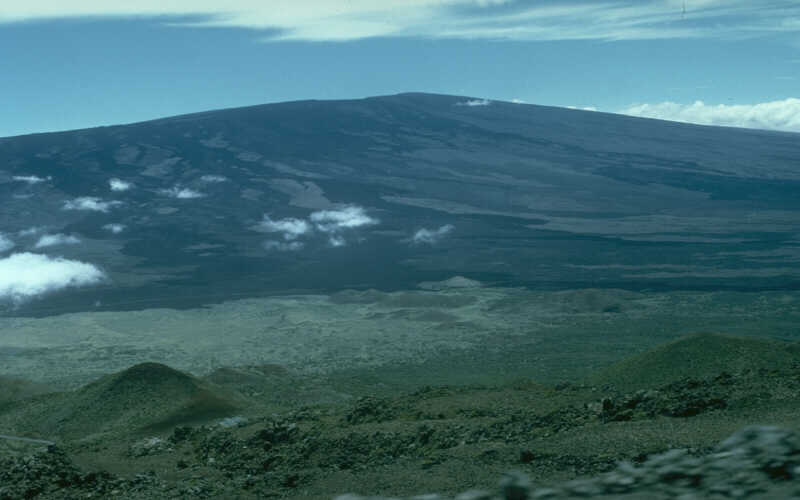
Figure 2: Mauna Loa on the big island of Hawaii is an example of a Shield Volcano (from USGS). (Click to enlarge)
Cinder / Scoria Cones (Figures 3 - 5) result from an increase in magma viscosity over Hawaiian-type eruptions. They are constructed of pyroclastic debris (solid rock fragments of various sizes from ash to large blocks) that are loosely held together and form a cone-shape with steep sides. Cinder cones are the smallest of the major types of volcanoes and are commonly found on the flanks of larger shield or stratovolcanoes. Usually cinder cones are short lived and don’t typically survive erosion for very long. They are often preserved only as remnants of their plumbing systems - called volcanic necks. Ship Rock in New Mexico and Devil’s Tower in Wyoming are two well known examples of volcanic necks. Examples of well known cinder cones include: Stromboli, Italy; Paricutin, Mexico; and Sunset Crater, Arizona.
 Figure 3: A cinder / scoria cone - Sunset Crater, AZ (from USGS) (Click to enlarge) |
 Figure 4: Cinder cone on the flank of Mount Etna, Italy (Click to enlarge) |
 Figure 5: Cinder Cones in Haleakala Crater in East Maui Hawaii. (Click to enlarge) |
Stratovolcano / composite cone (Figures 6 - 8) eruptions vary between alternating layers of thick, highly viscous lavas and pyroclastic material. These eruptions are violent, due to high gas content. Escaping gases can get trapped in the highly viscous magma building up tremendous pressure in the volcano until finally an eruption occurs, blasting ash and other rocky-glassy debris miles into the air. These are the tall, often snow and ice covered, classic cone-shaped volcanoes that we typically think of when envisioning a volcano. Well known examples include: Vesuvius, Italy; Mount St. Helens and Mt. Rainier , WA; Pinatubo, Philippines; Mt. Fuji, Japan; and Popocatepetl, Mexico.
 Figure 6: Stratovolcanoes Shishaldin (left) and Isanotski (right) in Japan. USGS photo by G. McGimsey. (Click to enlarge) |
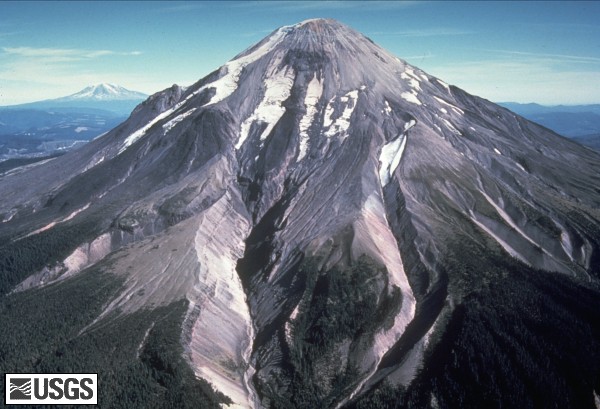 Figure 7: Mount St. Helens, an active stratovolcano of the Cascade Range, prior to the May 1980 eruption which removed the summit. (USGS photo) (Click to enlarge) |
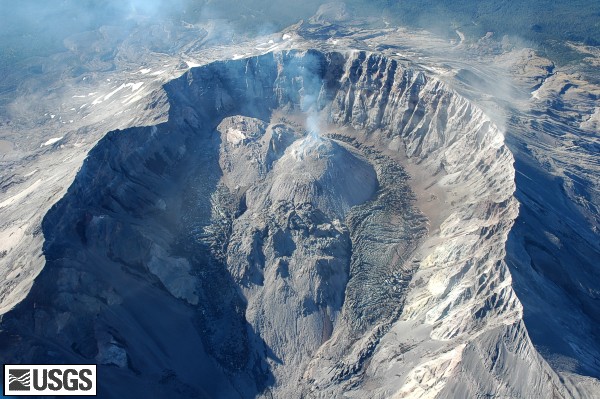
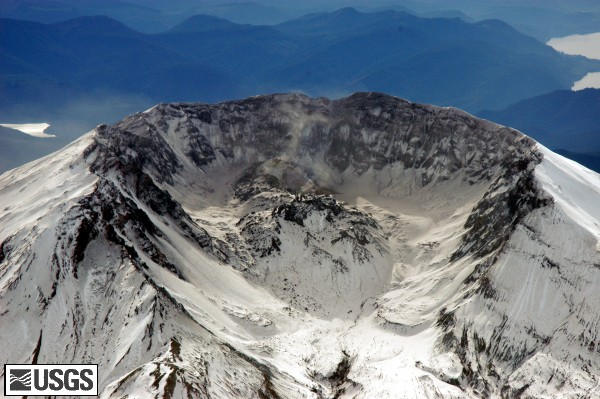 Figure 8: Mount St. Helens in 2004. The large crater and gaping hole at the summit are a result of the 1980 eruption. (USGS) (Click to enlarge) |
Lava Domes (Figures 9 – 10) are steep-sided dome-shaped masses of highly viscous lava that hardens immediately above the volcanic vent. The magma is so viscous that the vent of the volcano tends to get clogged and the sides of the mountain tend to get blown out rather than up.
 |
 (Click to enlarge) |
Calderas (Figures 11-12) are the largest of the violent types of volcanoes. They consist of large depressions (at least 1 km in diameter) that are formed when a volcano’s summit is blown off by a very explosive gas eruption, or by the collapse of the volcano into a partially emptied magma chamber, or both. Probably the most famous example in the US is the caldera at Crater Lake Oregon (Figure 11). Other notable examples include: Krakatau, Indonesia; Santorini, Greece; Long Valley, California; and Yellowstone, Wyoming.
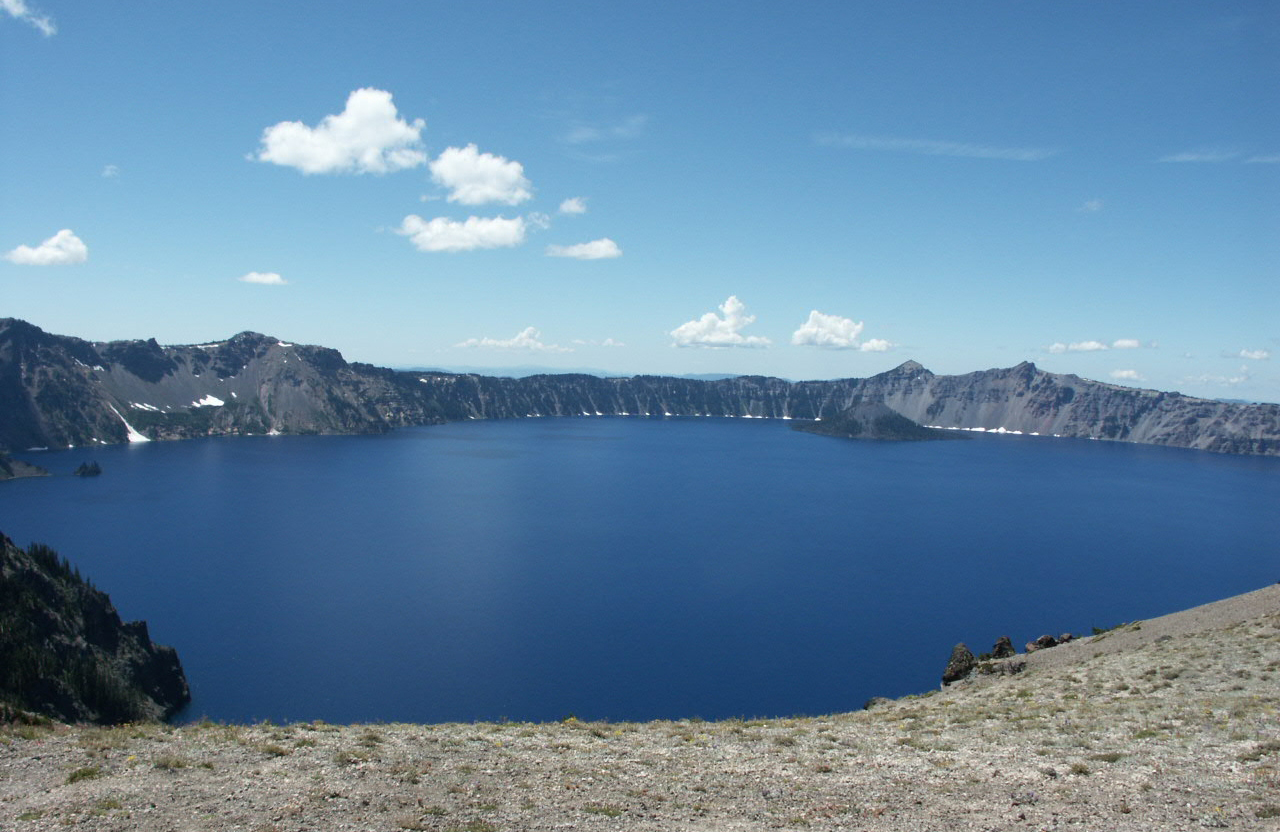 Figure 11: Crater Lake Oregon. A large water filled caldera created approximately 6,850 years ago when Mount Mazama stratovolcanoes blew up and collapsed. The caldera is approximately 6 miles wide and the lake nearly 2000 feet deep. (Click to enlarge) |
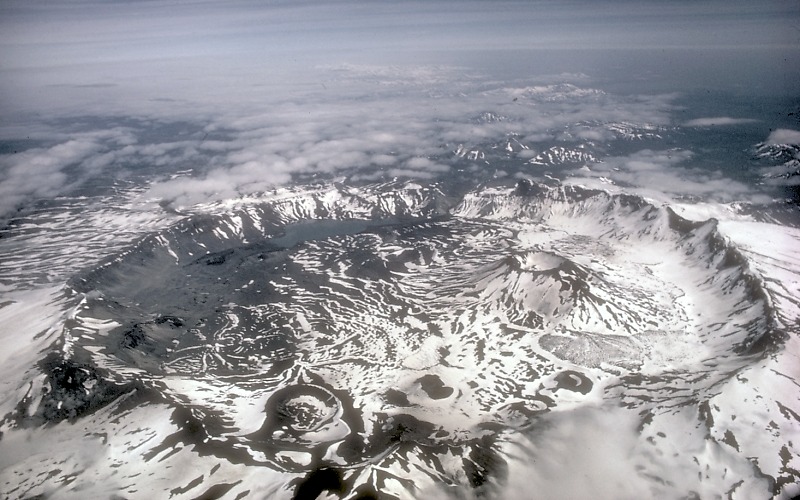 Figure 12: Aniakchak Caldera in the Aleutian Range, Alaska. This 10 km diameter caldera formed approximately 3,450 years ago. Note many smaller cinder cones within the caldera. (USGS photo) (Click to enlarge) |
| The global distribution of volcanoes
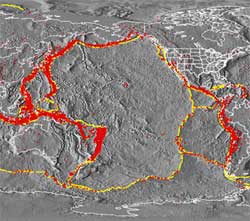
Volcanoes are not randomly located across the surface of the earth. Volcanoes are a result of plate tectonic activity and a look back at lesson 2, figure 7, will remind you that they are most abundantly found in narrow belts along plate margins. The highest concentration of active volcanoes on Earth today is located on plate margins surrounding the Pacific Ocean known as the Ring of Fire, illustrated by this USGS image depicting thermal activity around the margins. |
 |
Volcanic monitoring using satellites
Satellites, combined with advances in ground technology, have greatly increased our ability to detect and monitor volcanic events. Satellite-based sensing has become the crucial tool for understanding where, when, and why Earth’s volcanoes become active. Remote sensing further facilitates tracking of volcanic debris and ash clouds after an eruption occurs.
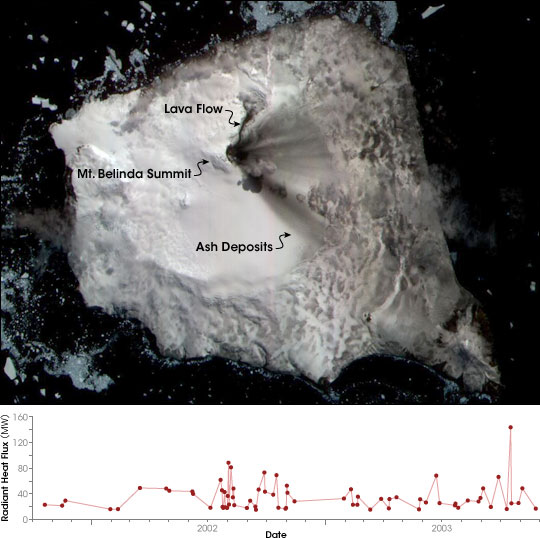
Figure 15: False-color image acquired in December 2003, by the Advanced Spaceborne Thermal Emission and Reflection Radiometer (ASTER) of Mount Belinda volcano. MODVOLC data below the image reflects the thermal activity of the volcano. (from NASA Earth Observatory)
(Click to enlarge)
MODIS Thermal Alert System, known as MODVOLC, enables geologists to detect volcanic activity anywhere in the world within hours of occurrence. MODVOLC uses data acquired by the Moderate Resolution Imaging Spectroradiometer (MODIS) sensors, which fly aboard NASA’s Terra and Aqua satellites. An example of this technology is shown below in Figure 15.
Scientists use two main techniques to measure ground movement from space, Interferometric Synthetic Aperture Radar (InSAR) and Global Position Systems (GPS). These techniques are highly complementary, InSAR provides a view of a wide area over a long period of time and GPS provides detailed time series for specific localities.
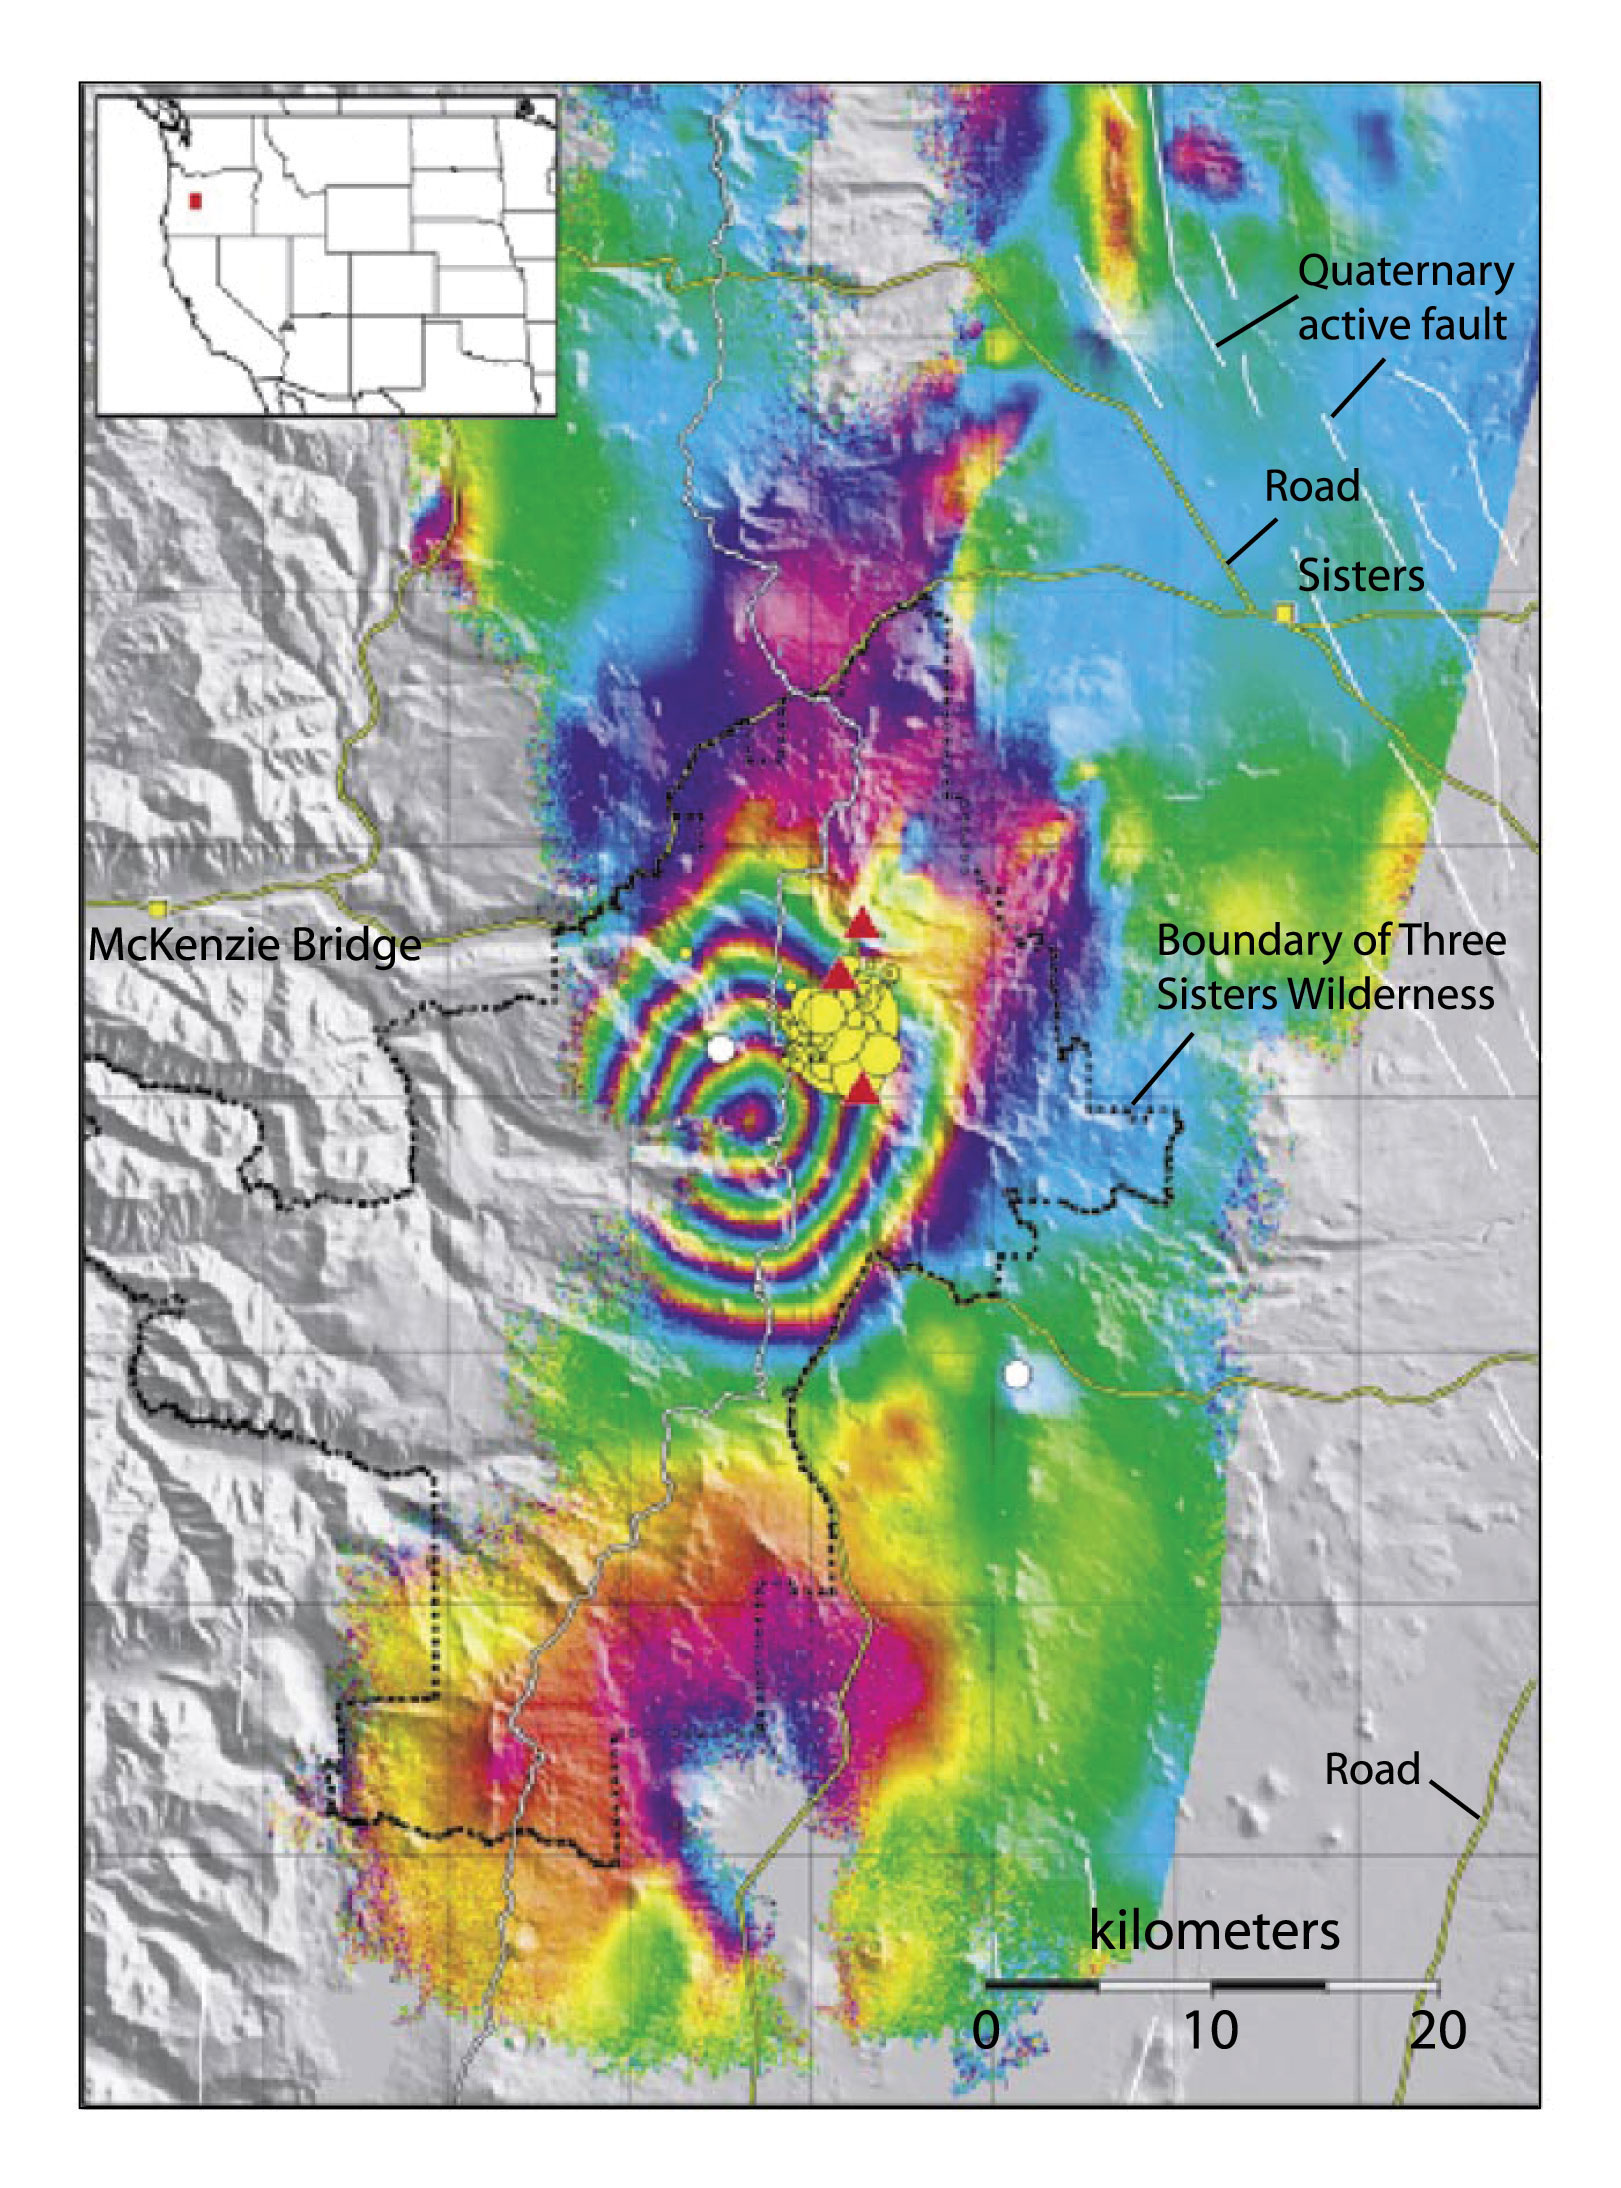
InSAR employs radars on satellites (ERS1, ERS2, JERS, IRS or Radarsat) that shoot radar beams toward Earth and record them after they bounce back. Images acquired at different times, but from the same location in space, can be used to detect even minor (a few centimeters) changes in the elevation of the ground. The InSAR data are processed into images, called interferograms (Figure 16). Ground movement, either up or down, is shown by the changes in color on the processed images (Figure 17). InSAR data can be combined to produce very high-resolution images that compare changes from one year to the next or multiple passes can be combined to show changes over a few years of time.
 Figure 16: InSAR image of ground deformation created using data from satellite passes from 1996 through 2000. The image shows 125 mm (about 5 in) of uplift centered within the northern end of Yellowstone caldera (black dotted line). Each full spectrum of color (red to purple) represents about 28 mm (1 inch) of uplift. The uplift is approximately 35 km x 40 km (22 miles x 25 miles) in size. (modified from USGS document) (Click to enlarge) |
 (Click to enlarge) |
GPS provides detailed time series information about a specific locality. Some of the benefits of GPS are the ability to continuously monitor a site, for example to take a measurement every few minutes, and to record information about movement along the surface of the Earth. ( north-south and/or east-west)
Measuring changes in the emission rate of gases, like carbon dioxide and sulfur dioxide, helps geologists detect changes that may signal an upcoming eruption. Since direct sampling can be dangerous, satellites armed with TOMS and OMI instruments have made this process a little easier. TOMS (Total ozone mapping spectrometer) and OMI (Ozone Monitoring Instrument) are instruments that, as their name implies, were initially designed to detect ozone levels in the upper atmosphere. As it turns out, they can also be used to track and detect sulfur dioxide gas emissions from volcanoes. Sulfur dioxide absorbs some of the same wavelengths as ozone so researchers developed an algorithm to use the TOMS and OMI data to measure volanic sulfur dioxide. Figures 18 and 19 are examples of some images produced using OMI technology.
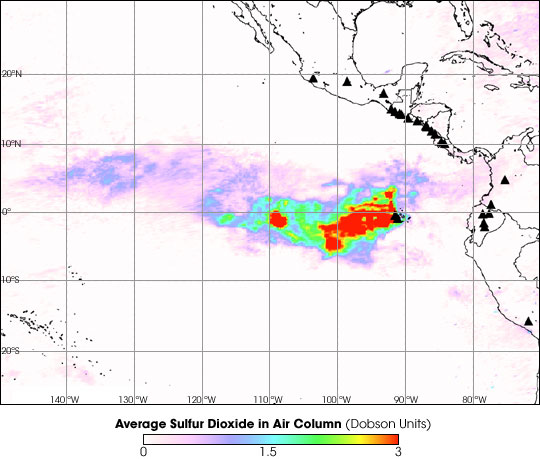 Figure 18: Concentration of sulfur dioxide over the Sierra Negra Volcano from Oct 23-Nov 1, 2005 measured by the Ozone Monitoring Instrument (OMI) on NASA’s Aura satellite. Red indicates the highest concentration. (Click to enlarge) |
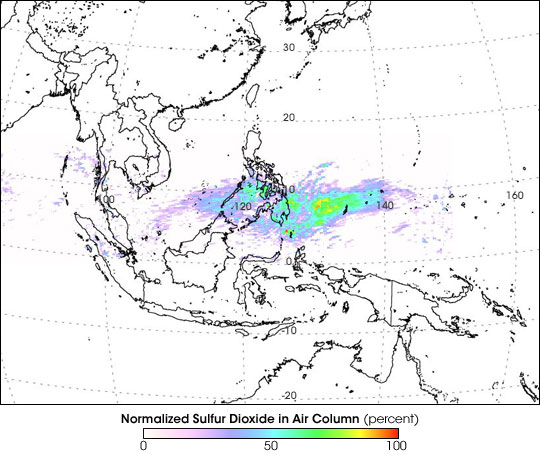 Figure 19: Another image of OMI sulfur dioxide concentrations from NASA Earth Observatory, this time featuring the Soufriere Hills Volcano in 2006. (Click to enlarge) |
Ash from volcanoes is a significant aviation hazard if it is drawn into jet turbines. As a result, the use of satellite-based monitoring and tracking of eruption clouds has been implemented. Volcanic cloud images during and shortly after an eruption can be optically thick and contain abundant water (and /or ice) and sulfur dioxide droplets which make their spectral signal very similar to a meteorological cloud. As time passes, however, the cloud disperses and becomes transparent. Fortunately the volcanic cloud signal can be distinguished from meteorological clouds using a brightness temperature difference algorithm using AVHRR (Advanced Very High Resolution Radiometer) instruments on NOAA polar orbitting satellites. The process uses a two channel discrimination of band 4 minus band 5 techniques. The use of AVHRR data sets to generate volcanic cloud images has allowed scientist to track clouds for several days after an eruption and after the ash has been transported for thousands of kilometers (Figure 21).
 Figure 20:An AVHRR image of the October 1994 eruption of Klyuchevskoy Volcano with simplified major air routes through the region. (from USGS) (Click to enlarge) |
 Figure 21: Crater Peak vent Mt. Spurr, Alaska eruption in September, 1992. The images shows the ash cloud tracked over 80 hr using band 4-5 brightness temperature difference images from AVHRR data. (Click to enlarge) |
While traditional views from high flyinh geostationary satellites are not as helpful as polar orbitting satellites for monitoring volcanoes, the 2010 eruption of the Iceland Eyjafjallajökull Volcano showed that the SEVIRI instrument on Meteosat-9, with more spectral resolution than AVHRR, (and consistent temporal resolution) yielded abundant information about the ash cloud, including total mass, maximum height, and effective radius.
Puff, a volcanic ash tracking model, was developed to simulate the transport and dispersion of volcanic ash clouds and is now in use by the Alaska Volcano Observatory for predicting the trajectories of ash clouds for hazard assessments (see Figure 22 for an example).
Figure 22: Ash cloud animation from Mount Augustine Alaska eruption in January 2006 using “Puff” technology.
(from the Alaska Volcano Observatory)
(Click to enlarge for animation)