Satellite Perspectives of the Water Cycle
Water cycles into and out of the atmosphere, lithosphere, hydrosphere, and biosphere. Powered by the sun, the water cycle integrates all living and non-living components of Earth. Satellites accurately monitor most aspects of the water cycle, especially weather phenomena such as clouds and storms formed by condensation, precipitation in the form of rain, snow and floods, bodies of water such as oceans, rivers, lakes and frozen water in the form of snow cover, sea ice and ice sheets. Satellite data can also identify areas of evaporation and transpiration.
The main satellites monitoring the weather are NOAA's Geostationary Operational Environmental Satellites (GOES) and Polar Operational Environmental Satellites (POES) which carry scanning radiometers designed to detect upwelling terrestrial radiation in discrete wavelength bands. The GOES satellites have been on the job 24 hours a day, 7 days a week since 1974, supplying a comprehensive picture of the global water cycle through visible, infrared and water vapor imagery. Animations of infrared satellite imagery provide excellent examples of cloud condensation while water vapor imagery helps meteorologist track moisture in the troposphere while identifying features critical to forecasting and aviation such as the jet streams. | |||
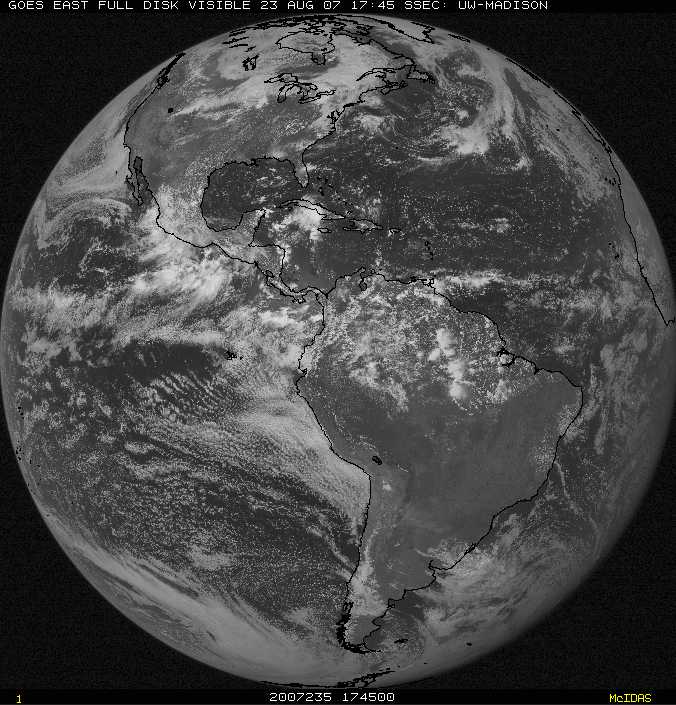 GOES visible image depicting liquid water in clouds and the oceans |
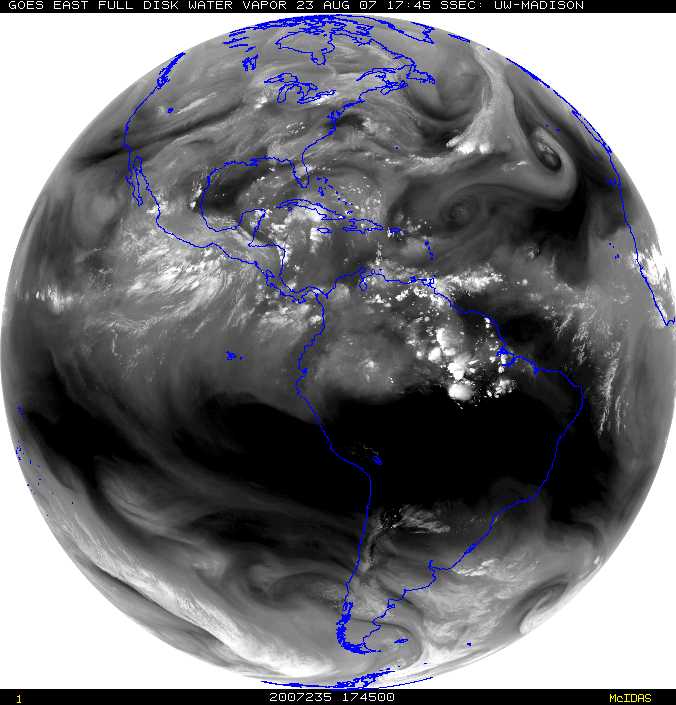 GOES water vapor image depicting water as a gas in the atmosphere |
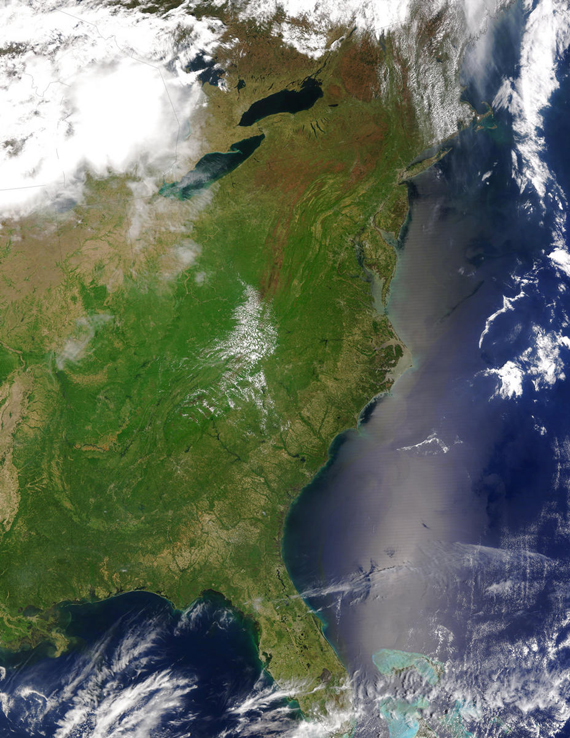 POES visible image indicating transpiration during spring green-up |
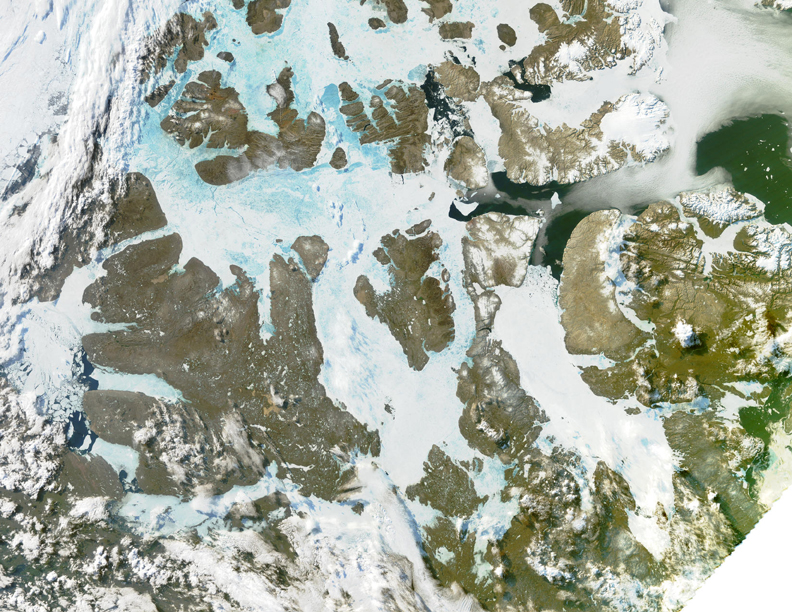 POES visible image depicting solid water as ice and snow in the Arctic |
More recently, NASA's low earth orbiting research satellites are helping scientists probe deeper into the details of the water cycle. These include the Earth Observing Satellites (EOS) which are similar to POES and provide information on atmospheric humidity, clouds, snow and ice, vegetation, and water storage. Additional NASA satellites called CALIPSO and CloudSat are measuring precipitation and providing detailed cloud cover data. NASA also launched twin satellites in 2002 called GRACE (Gravity Recovery and Climate Experiment) that measure Earth's gravity field which translates to the total water content of glaciers, lakes and even groundwater. Using GRACE data, NASA scientists mapped the complete cycle of water movement for the entire South American continent. Finally, global precipitation is being measured by satellite-borne radars on the Tropical Rainfall Measuring Mission or TRMM satellite, which flies a unique orbit over the tropical and semi-tropical latitudes. | ||
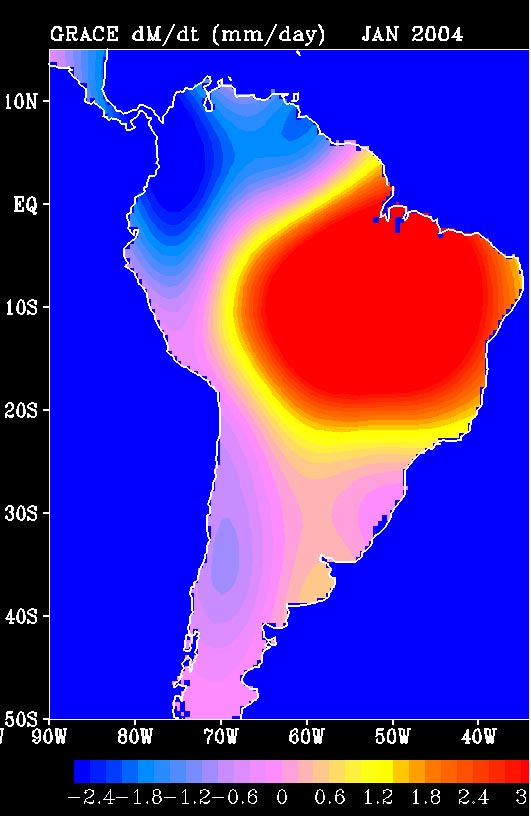 GRACE data shows water distribution in S. America |
 CloudSat profiling radar depicts liquid water in thunderstorms |
 TRMM rainfall climatology ( 50 ° N to 50 ° S) |
The great majority of the water on Earth is stored in the oceans. Satellite observations offer the most comprehensive and cost effective means to monitor these vast expanses where collecting in situ data is virtually impossible. This is especially true for the southern hemisphere where the Atlantic, Pacific and Indian Oceans constitute more than two thirds of the surface area.
Satellite Perspectives of the Energy Cycle
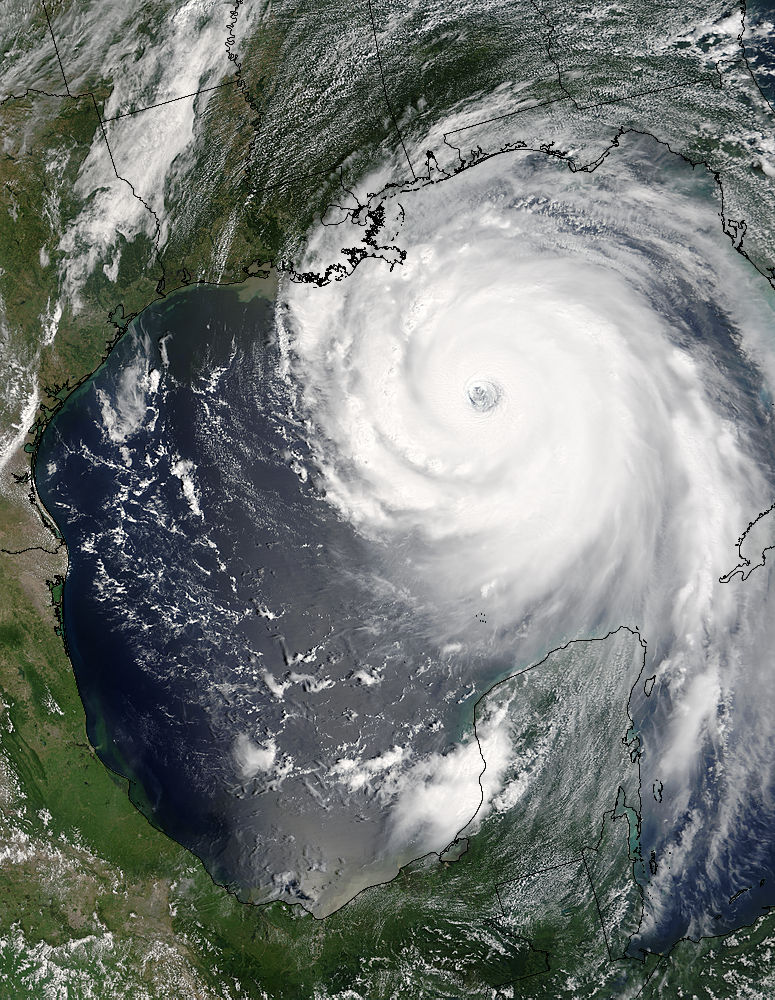
Visible Image of Hurricane Katrina
The water cycle is closely connected to the energy cycle. This is because much of the energy transferred between the ocean and atmosphere and the poles and the equator is enabled by the unique properties of water.
The Sun is the source of all energy on Earth. Energy cycles through the atmosphere via electromagnetic radiation or during the phase change of water. As with all energy, radiation can change form, but it must be conserved. When electromagnetic energy moves through the atmosphere it can be absorbed, reflected, or transmitted. Approximately 50% of the solar energy reaching the planet passes through the atmosphere and is absorbed by the surface of the Earth and converted into transferable heat. Shortwave solar radiation warms the ocean surface and causes water molecules to evaporate from liquid to vapor. As the gas rises, it carries with it the energy that was required to turn that liquid water into water vapor. This is latent energy ready to be released again when the vapor condenses into liquid. Three fourths of the energy transferred to the atmosphere from the oceans occurs due to the phase change of water.
Satellites illustrate condensation and cloud development at all latitudes, including tropical storms and hurricanes. Radars on satellites measure global precipitation, sounders on satellites relay relative humidity data, and water vapor imagery routinely depicts the flow of moisture in the atmosphere.
Satellite Perspectives of the Rock Cycle
The rock cycle is readily displayed in satellite imagery. Geologists refer to images from low earth orbiting satellites such as Landsat, EOS, or POES to verify basic rock types and formations. Satellite imagery helps scientists monitor the processes by which rock changes from one form to another over time.
|
Satellite geology began in the 1970s with the Landsat program, when detailed images of every region of the globe became available every 18 days. Geologists can study satellite images for multiple purposes such as delineating fault lines or discovering the geochemistry of rock outcrops and even hunting for dinosaur fossils. More recently, altimeters on satellites are providing insight into seafloor topography, plate tectonics and undersea volcanoes while GPS units on satellites measure minute changes and shifts along tectonic fault lines. | ||
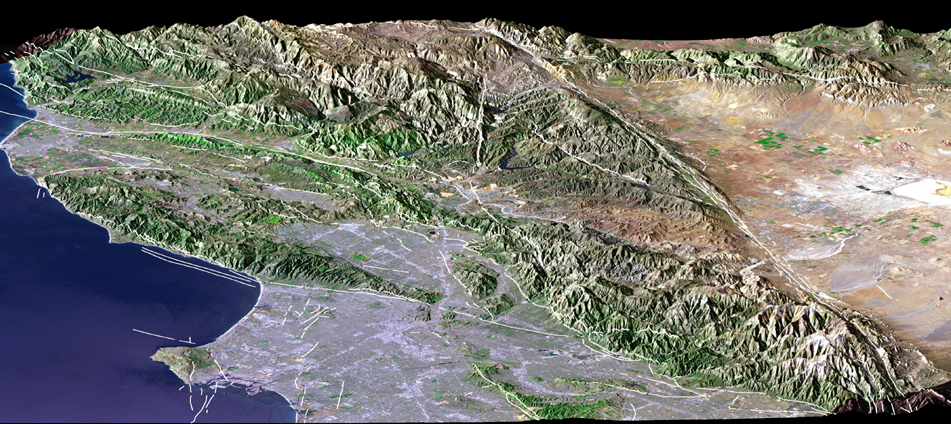 Landsat visible image draped over a topographic map for a 3-D view of the San Andreas fault in California |
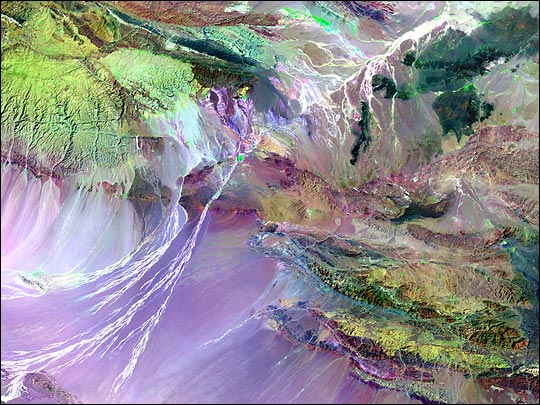 Landsat infrared false color image of the Gobi desert exposing potential fossil sites |
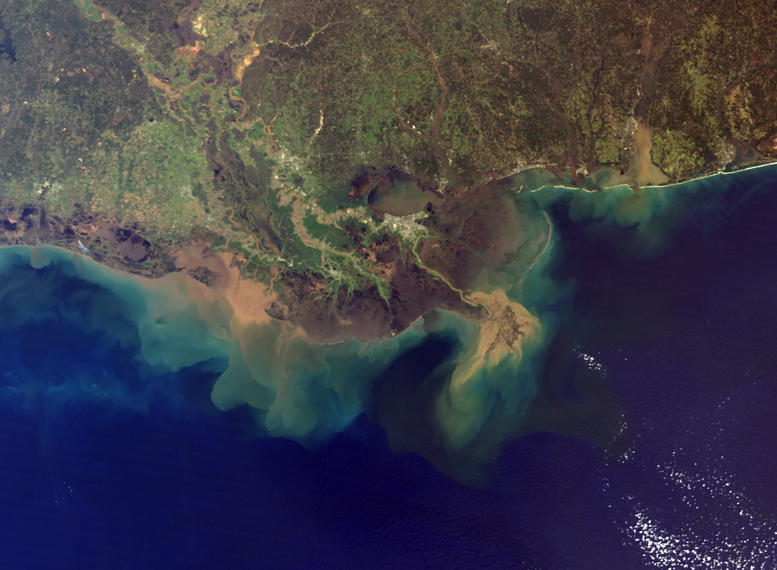 EOS visible image of the Mississippi delta depicting sediments from erosion and weathering processes |
Because moving water is the most powerful geologic force sculpting the landscape, the rock cycle is intimately connected to the water cycle. The bulk of precipitation that falls on land infiltrates the lithosphere to be stored in massive groundwater reservoirs. Occasionally, sea water is pulled deep into the Earth's interior via geologic subduction zones and doesn't return to the hydrologic cyle until it is released as steam in a volcanic eruption.
Satellite Perspectives of the Carbon Cycle
Carbon in the Earth system cycles through rocks, oceans, the atmosphere, and biosphere. The biosphere refers to all living organisms and includes essential chemical reactions such as photosynthesis, transpiration and respiration. The biosphere is structured into a hierarchy called the food chain where life is dependent upon primary producers capable of photosynthesis.
|
Satellite images are particularly useful for monitoring photosynthesis on land and in the oceans, especially low earth orbiting satellites like EOS and POES which can observe and report on the greenness of Earth’s landscapes. For any location on Earth, the greener the surface the greater the amounts of carbon being used through photosynthesis. This is true for the oceans where phytoplankton use chlorophyll to capture energy from the sun and convert water and carbon dioxide into new plant material and oxygen through photosynthesis. This process can be monitored and measured from space. | ||
|
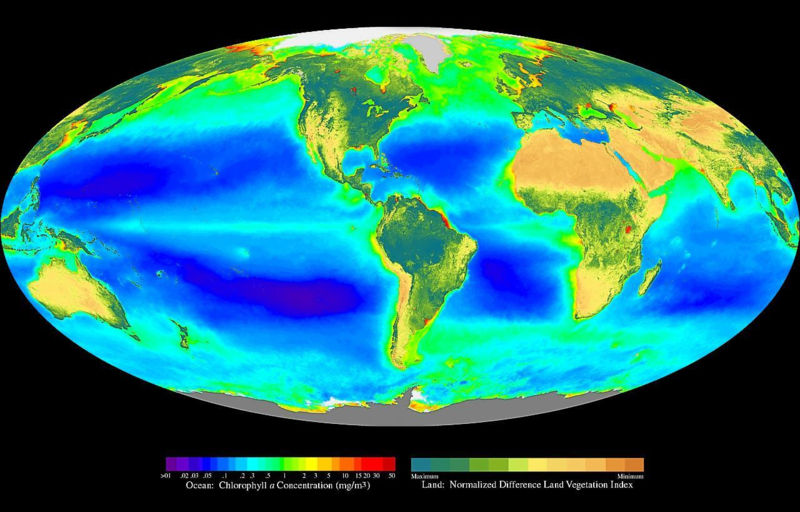 Global map indicating plant activity and carbon sinks |
|
The total amount of carbon in the ocean is 50 times greater than the atmosphere, and is exchanged on a time-scale of several hundred years.
Carbon in the atmosphere is primarily in the form of carbon dioxide (CO2). The amounts of CO2 in the atmosphere varies with time of day and season. Unlike water vapor, CO2 tends to mix evenly throughout the atmosphere over time, although it is continuously produced and absorbed near the surface by natural and human-induced processes.
The longest continuous record of direct atmospheric CO2 measurements comes from the Mauna Loa Observatory in Hawaii which began in 1958. NOAA also manages a global network of air sampling sites with on-line data starting in 1980 from cooperative observers who collect flasks of air on a weekly basis.
While the surface network of atmospheric carbon dioxide sampling is fairly extensive, there is a dearth of data in the Southern Hemisphere. This gap combined with the increasing role of carbon dioxide in global climate scenarios presents an obvious need for the spectral and temporal resolution provided by satellite observations of the global carbon cycle to better understand the sources and sinks of carbon on Earth.
There are three carbon dioxide absorption bands in the infrared region of the electromagnetic spectrum at 2.7, 4.3, and 15 microns. This means that shortwave solar radiation (~0.6 microns) is not absorbed by atmospheric CO2 when it travels to Earth, so that the carbon dioxide absorption bands on satellite instruments measure longwave upwelling terrestrial radiation based upon the amount of CO2 in the atmosphere. Scientists can then infer mean atmospheric CO2 concentrations using nonlinear regression schemes based on temperature, providing comprehensive information about the role and contribution of CO2 as it relates to global climate change.