|
Global Warming
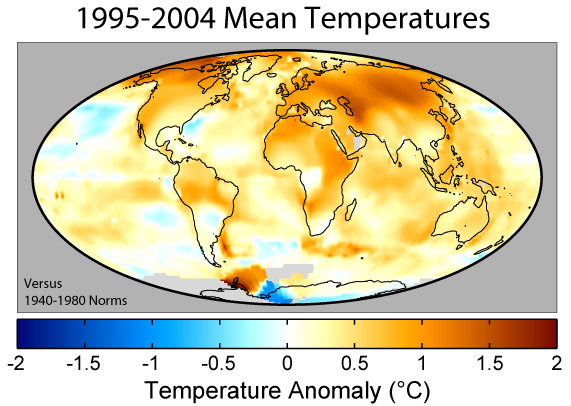
Earth has warmed steadily during the past century with dramatic increases in the last two decades.
Earth is now warmer than it has been in the last 1000 years.
One reason for this temperature increase is that human activity has resulted in more greenhouse gases that trap energy and heat in the lower atmosphere. Warmer atmospheric temperatures enable an increase in the most abundant greenhouse gas, atmospheric water vapor (H20). Increased water vapor can warm the atmosphere further, leading to a further increase in atmospheric water vapor via a positive feedback loop.
|
click to enlarge |
|
However, increased water vapor amounts may also enhance cloud cover that can cool the planet. Whether increased water vapor and cloud cover will ultimately warm or cool the planet is a source of uncertainty under close study by remote sensing and climate experts.
|
Glaciers
Warming temperatures has resulted in a widespread retreat of nonpolar glaciers. More than 110 glaciers have disappeared from Montana’s Glacier National Park over the past 150 years and researchers estimate that the remaining 37 will be gone by 2040.
While current melting trends can’t be reversed, information collected by satellites helps researchers understand the relationship between climate and glaciers important for managing local water supplies and predicting future climate change. |
Himalayn Glacier
click to enlarge |
|
Artic sea-ice thinning
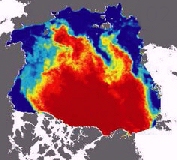
Artic Sea Ice
click to enlarge |
Recent satellite studies indicate Arctic sea ice is declining annually.
Scientists can differentiate the seasonal ice from the older, perennial ice by using data from scatterometer
instruments that send radar pulses to the surface of the ice and measure
the echoed radar pulses bounced back to the satellite.
As ice thins and melts, it leaves behind an ocean that does not
refreeze. This, in turn, increases ocean heating and leads to additional thinning
of the ice cover, a positive feedback mechanism conducive to global warming. |
|
Reductions in Snow Cover
Northern Hemisphere snow cover has decreased in area by 10% since the 1960s.
This is important to climate because snow reflects significant amounts of
solar radiation that would otherwise be absorbed at the
Earth's surface.
Snow cover also has a higher emissivity than snow-free
ground resulting in enhanced infrared cooling. Additionally, a blanket of snow prevents heat stored in the ground
from being released to the overlying atmosphere. Snow cover information has been provided by NOAA weekly snow extent charts derived from visble imagery from both polar and geostationary satellites for several decades. More recently, scientists have been incorporating
snow cover data from NASA EOS polar orbitting satellites,
the visible-spectrum MODIS sensor on the Terra satellite
and the AMSR-E passive microwave sensor on Aqua. Both
data sets have a higher spatial
resolution than their predecessors which should lead to increased
accuracy in snow mapping.
|
|
Sea Level Rise
Thinning sea ice and melting glaciers add mass to the oceans, causing sea level to rise. Warmer waters cause expansion, which also results in rising sea levels. Altimeters on satellites provided the first detailed picture of global sea level and now track its change. Studies show that sea level increased at an annual rate of 1 to 2 mm during the 20th century.
|
Ocean Topography
click to enlarge |
|
Altimeters measure total ocean height. To determine what part of sea level rise is due to added mass, scientists can look to NASA's Gravity Recovery and Climate Experiment (GRACE)
mission, tandem satellites that sense changes in gravitational pull from different planetary features. When glaciers or ice sheets melt, it registers as a minute gravity related change in the distance between the two satellites. |
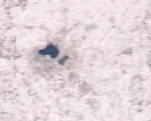
Desertification
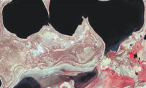
click to enlarge |
Satellites provide the global monitoring necessary for understanding desertification and the impact of people and animals on the Earth.
Landsat images of the same area, taken several years apart but during the same point in the growing season, can indicate changes in the susceptibility of land to desertification. In extreme cases, satellite imagery can document shrinking bodies of water. |
|
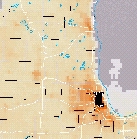
Urban Heat Islands
The urband heat island is a well-documented example of inadvertent modification of climate by human activities. Concrete and buildings absorb more solar radiation than surrounding rural areas and alter regional climate. This is readily illustrated by infrared imagery. |
|
|
Longer Growing Seasons
The U.S. Department of Agriculture and other researchers routinely use data from geostationary satellites to measure
growing seasons by monitoring chlorophyll activity in the vegetation. Scientists are noting that the growing season is getting longer, especially at higher latitudes where over a week has been added since 1970. |
|
Ice Cover Duration Diminishing
During the past 150 years, the winter ice cover of streams and lakes has declined, and in the northern hemisphere there has been a steady trend toward later freeze and earlier ice breakup, with the overall duration shortened by two weeks.
|
 click to enlarge
|
While multiple methods provide clues to past climates, satellite observations offer the most comprehensive and cost effective means to monitor global and regional climate change.