


CIMSS GOES-13 Science Test
News
- GOES-13 arrived on station at 105 degrees West Longitude on 8 November 2006.
- The GOES-13 NOAA Science Test is scheduled to run from 7 through 28 December 2006.
- GOES-13 is scheduled to enter storage mode on 25 December 2006.
1. Preamble
At the Cooperative Institute for Meteorological Satellite Studies (CIMSS) and Advanced Satellite Products Team (ASPT), there are three main goals for the GOES-13 science test. First, the quality of the GOES-13 data will be investigated. This may be accomplished by comparing to other satellite measurements or by calculating the signal-to-noise ratio. The second goal will be to produce products from the GOES-13 data stream and compare to those produced from other satellites. These products may include: temperature/moisture retrievals, total precipitable water, lifted index, cloud-top pressure, and sea surface temperatures. The third goal is to investigate the impact of the recent instrument changes. For example the better navigation and the operation thru eclipse.
2. Executive Summary
New features of GOES-13's imager:
- GOES-13 has similar instruments to GOES-8-12, but is on a different spacecraft bus. The new bus allows improvements both to the navigation and registration, as well as the radiometrics (e.g., better signal-to-noise ratio).
- The GOES-13 imager and sounder will be able to operate thru the eclipse periods, whereas previous instruments could not.
3. First Images
The first visible GOES-13 Sounder image was 16:01 UTC on 22 June 2006 and can be seen at the CIRA GOES-13 PLT Page. Researchers at CIMSS and ASPB noticed that it was too dark. An adjustment to calibration coefficients was applied on 6 July 2006 by NOAA OSO (Office of Satellite Operations). A comparison showing "before" and "after" this adjustment and a comparison to GOES-12 visible sounder imagery are shown here.
4. Products
4.1 - Cloud Information
The GOES-13 Imager Clear Sky Brightness Temperatures (CSBT) product is generated every 3 hours in near real-time. This product spatially averages the clear fields of view for use in global numerical weather prediction (NWP) applications. In general, there is fair agreement between the GOES-12 and GOES-13, with correlation coefficients between 0.96 and 0.98, varying by band.

GOES-11, -13 and -12 sample clear-sky brightness temperatures for the nominal time of 12 UTC on Dec 22nd.
Follow the links to see scatter plots comparing GOES-12 to GOES-13 Imager CSBT for Band 2 (3.9 µm), Band 3 (6.7 µm), Band 4 (11µm), and Band 6 (13.3µm).
4.2 - Total Precipitable Water
4.3 - Lifted Index
4.4 - Multi-Panel Display Of All 19 Channels From The GOES-13 Sounder
4.5 - Satellite-Detected Fires
Basic fire detection relies primarily on the 3.9µm (band 2) data from the GOES Imager. This provides the basis for locating the fire and other information aids in estimating the sub-pixel fire size and temperature. The number of fires that can be successfully detected and characterized is related to the upper limit of the observed brightness temperature in the 3.9µm band. The saturation temperature of the 3.9µm band limits the number of fires that can be detected and processed. The higher the saturation temperature, the greater the opportunity to identify and estimate sub-pixel fire size and temperature. Low saturation temperatures can result in the inability to distinguish fires from the hot background in places where the observed brightness temperature meets or exceeds the saturation temperature.
5. Case Studies
The CIMSS Satellite Blog has a GOES-13 section where interesting cases will be discussed.
5.5 - 08 December 2006 | Detecting Surface Features in the Water Vapor Channel Imagery
This link will take you to the CIMSS Satellite Blog; use the back button on your browser to return to this page.
5.4 - 07 December 2006 | First Day of Post Launch Science Test (Lake Effect Snow)
This link will take you to the CIMSS Satellite Blog; use the back button on your browser to return to this page.
5.3 - 22 November 2006 | Mountain Waves: GOES-11 vs GOES-13
This link will take you to the CIMSS Satellite Blog; use the back button on your browser to return to this page.
5.2 - 09 November 2006 | Tropical Storm Rosa
This link will take you to the CIMSS Satellite Blog; use the back button on your browser to return to this page.
5.1 - 12 September 2006 | Wildfires in Montana
This link will take you to the CIMSS Satellite Blog; use the back button on your browser to return to this page.
6. Calibration
6.1 - Signal to Noise
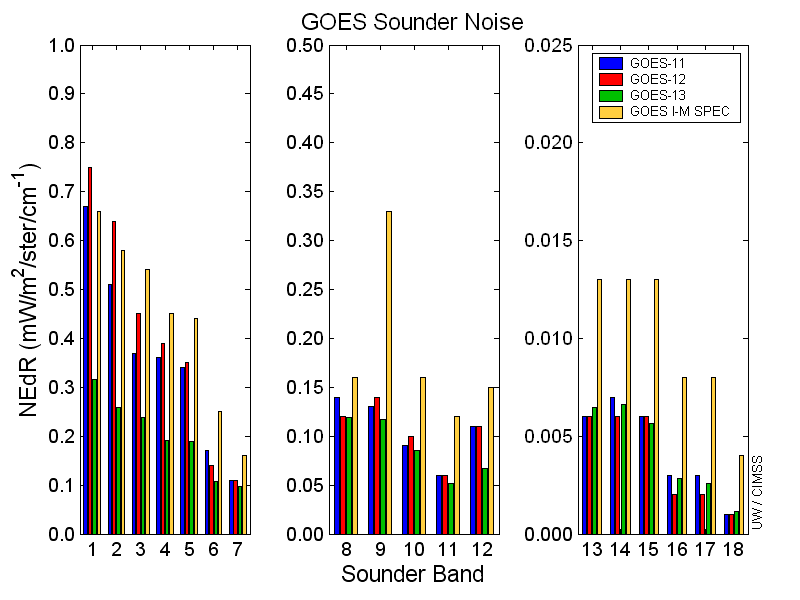
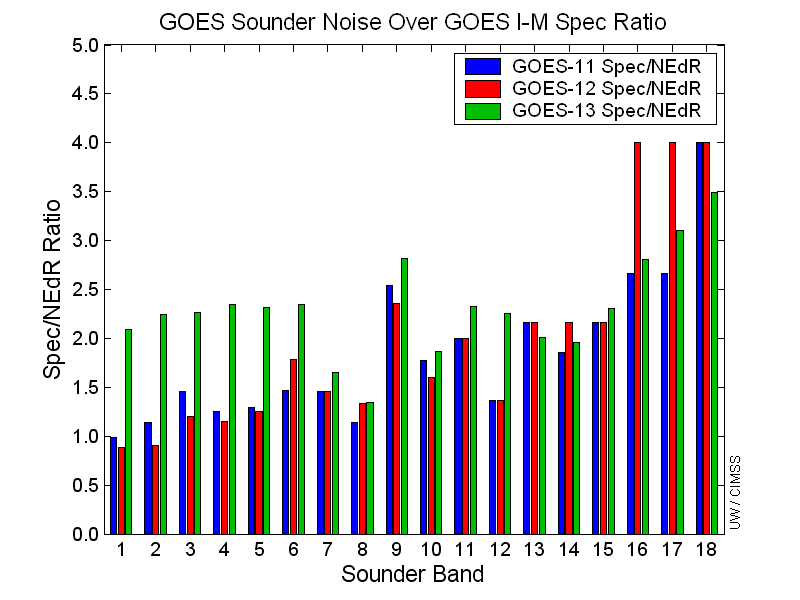
Special GOES-13 Sounder sectors which include space views allow noise values to be determined by the scatter of radiance values looking at uniform space. Preliminary indications from December 10 show that GOES-13 appears to be within specifications for all bands. This bar plot comparing GOES-11, GOES-12 & GOES-13 to specs illustrates the improvement in most bands. Another way to look at it is by comparing a ratio of the spec to measured noise seen in this plot. The GOES-13 signal to noise values (mW/m2/ster/cm-1) compared well to those from other satellites:
Wavelength  Channel  GOES-08   GOES-09   GOES-10   GOES-11   GOES-12  GOES-13    SPEC (GOES I-M)
  14.70        1       1.76      1.16      0.71      0.67      0.75     0.32     0.66
  14.40	       2       1.21      0.80      0.51      0.51      0.64     0.26     0.58
  14.10	       3       0.98      0.56      0.41      0.37      0.45     0.24     0.54
  13.90	       4       0.74      0.46      0.41      0.36      0.39     0.19     0.45
  13.40	       5       0.68      0.45      0.36      0.34      0.35     0.19     0.44
  12.70	       6       0.32      0.19      0.16      0.17      0.14     0.11     0.25
  12.00	       7       0.20      0.13      0.09      0.11      0.11     0.10     0.16
  11.00	       8       0.13      0.09      0.12      0.14      0.12     0.12     0.16
   9.70	       9       0.16      0.11      0.10      0.13      0.14     0.12     0.33
   7.40	      10       0.08      0.08      0.07      0.09      0.10     0.09     0.16
   7.00	      11       0.07      0.05      0.04      0.06      0.06     0.05     0.12
   6.50	      12       0.11      0.09      0.07      0.11      0.11     0.07     0.15
   4.57	      13       0.012     0.008     0.007     0.006     0.006    0.007    0.013
   4.52	      14       0.010     0.007     0.005     0.007     0.006    0.007    0.013
   4.45	      15       0.009     0.006     0.005     0.006     0.006    0.006    0.013
   4.13	      16       0.004     0.003     0.003     0.003     0.002    0.003    0.008
   3.98	      17       0.004     0.003     0.002     0.003     0.002    0.003    0.008
   3.70	      18       0.002     0.001     0.001     0.001     0.001    0.001    0.004
6.2 - Spectral Response Functions
The normalized Spectral Responses give indications of the expected radiance differences between sensors or instruments.
Imager:
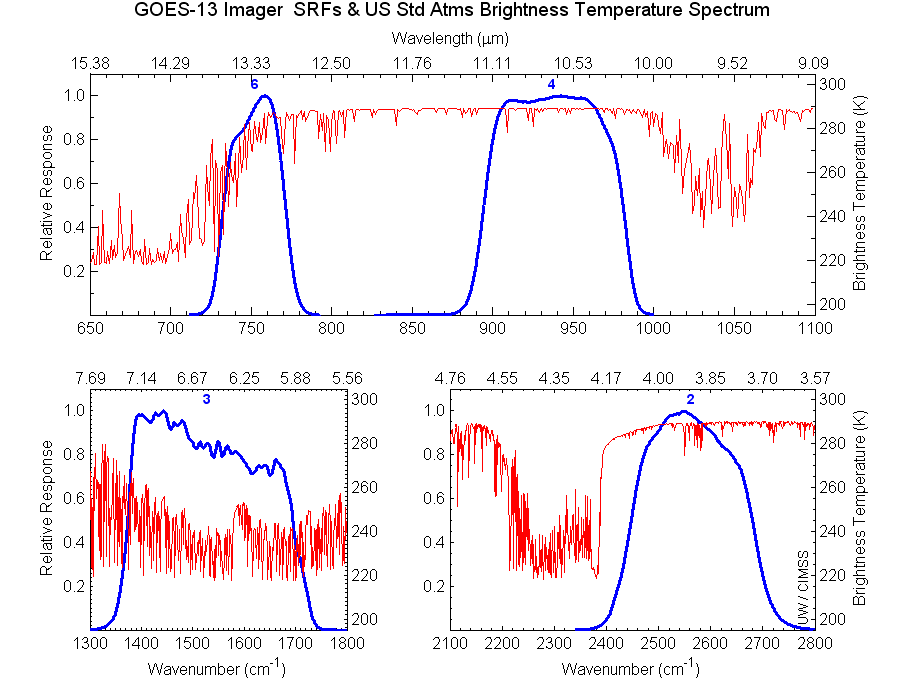
Imager Infrared Spectral Responses for GOES-13 compared to Calculated US Standard Atmosphere Spectrum
Sounder:
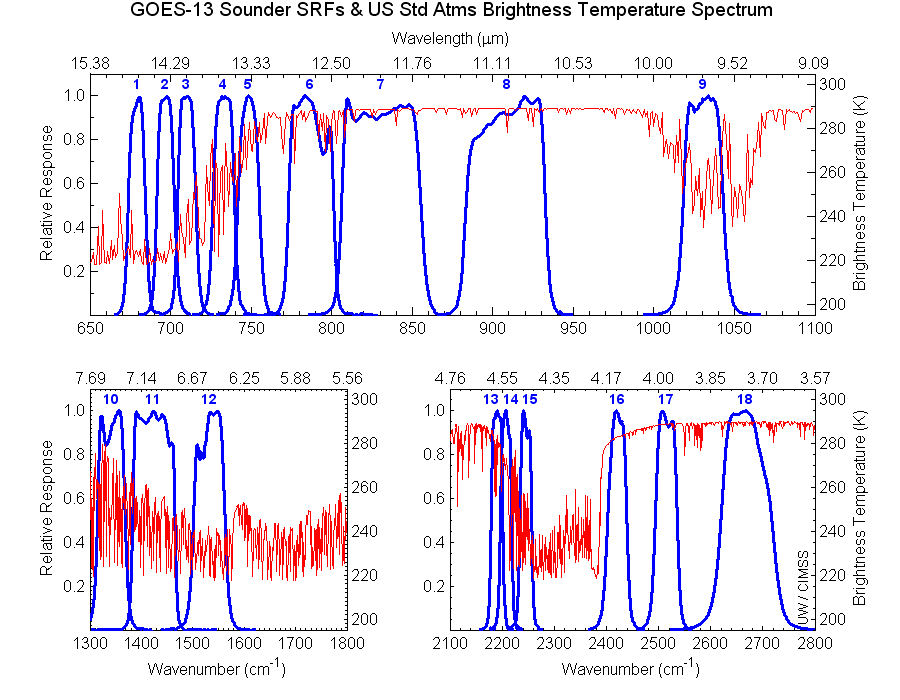
Sounder Infrared Spectral Responses for GOES-13 compared to Calculated US Standard Atmosphere Spectrum
Links
Use your browser's "back" button to return to this page:
- RAMMB
GOES-13 Science Test
- NOAA
GOES Calibration Page
- CIMSS Satellite Blog
- The
FPDT (NOAA/NESDIS) GOES Page
- CIRA
RAMSDIS Online
- CIMSS
GOES-11 Science Report
- CIMSS
GOES-12 Science Report
- CIMSS
GOES-12 "Working" page
- Back to the CIMSS Home Page
Unless otherwise noted, all satellite data are provided by the Data Center at the Space Science and Engineering Center (SSEC) of the University of Wisconsin - Madison and are displayed using McIDAS, the Man computer Interactive Data Access System.
Questions or Comments? Mail us! Last Updated: 18 December 2006 Disclaimer.