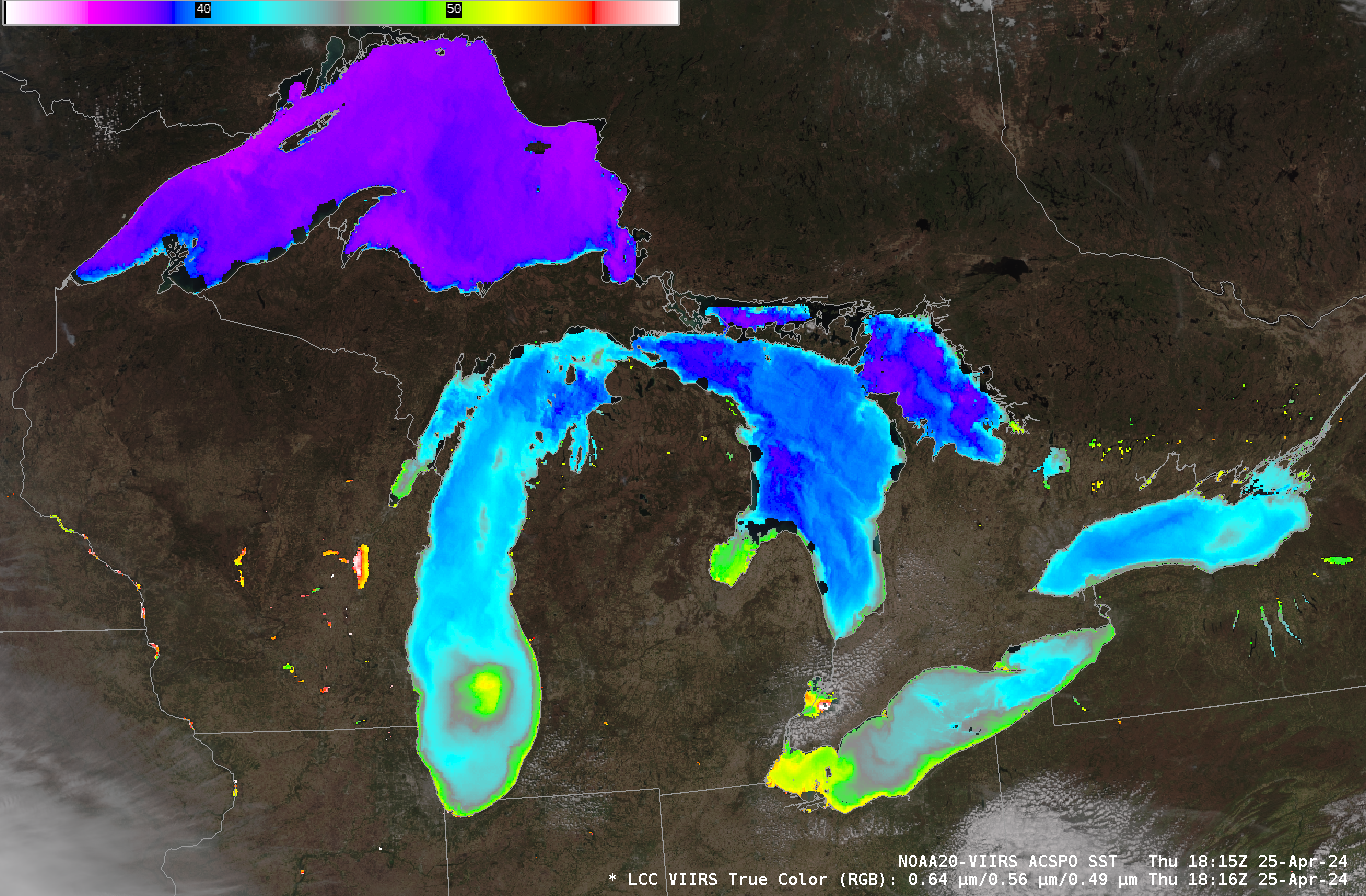
Severe weather outbreak across the southeastern US

January 23rd, 2012
GOES-13 10.7 µm IR channel images + severe weather reports (click image to play animation)

GOES-13 10.7 µm IR channel images + severe weather reports (click image to play animation)

A major outbreak of severe thunderstorms along a strong cold frontal boundary swept eastward across much of the southeastern US on 22 January23 January 2012, producing widespread damaging winds, large hail, and tornadoes (SPC storm reports). Two tornadoes produced EF-3 damage in Alabama. AWIPS images of 4-km resolution GOES-13 10.7 µm IR channel data with overlays of severe weather reports (above; click image to play animation) showed the cold cloud top IR brightness temperatures of -60 to -70 C (red to black color enhancement) associated with some of the strongest storms. For more information, see summaries from the National Weather Service forecast offices at Litttle Rock AR, Jackson MS, and Birmingham AL.

POES AVHRR 12.0 µm and MODIS 11.0 µm IR images

POES AVHRR 12.0 µm and MODIS 11.0 µm IR images

A sequence of 1-km resolution POES AVHRR 12.0 µm IR and MODIS 11.0 µm IR images (above) displayed greater detail in the storm top thermal structures, with a number of  -70 to -80 C (black to light gray color enhancement) IR brightness temperature values seen on the higher resolution imagery.

Of particular interest was what appeared to be some sort of “cloud trench” oriented from north to south across Tennessee around 08:00 UTC, which exhibited significantly warmer MODIS 11.0 µm IR brightness temperatures and a warmer/drier signal on the corresponding MODIS 6.7 µm water vapor image (below). This feature was also apparent on a few of the 4-km resolution GOES-13 IR images around that time. The etiology of this satellite signature is unclear at this time.

MODIS 11.0 µm IR channel and 6.7 µm water vapor channel images

MODIS 11.0 µm IR channel and 6.7 µm water vapor channel images

Mysterious Gravity Wave Over the Eastern Pacific Ocean

November 14th, 2011

We received the following email from Ken Waters of the National Weather Service forecast office in Phoenix, Arizona:

I noticed something interesting in this morning’s visible imagery off the Baja California coast.

Here’s a link: https://docs.google.com/open?id=0B2ktDMIN5qWfODI2OTYzYjgtZjJkMS00MTU5LTk2ODctYzdhNzY5M2Y2MWIx

I’m looking at the apparent wave pattern that’s going “upstream” towards the northeast whereas the low level flow is mostly towards the south. Is that a gravity wave? If so, what causes it? The vis can only go so far back so I looked at the IR and couldn’t find anything obvious.

Great question Ken — it certainly appears to be some sort of internal gravity wave, but what caused it and why was it propagating against the ambient flow shall remain a bit of a mystery until we can dig into this case a bit further. One more event for the “What the heck is this?” blog category.

GOES-15 6.5 µm water vapor channel images + GOES-15 0.63 µm visible channel images

GOES-15 6.5 µm water vapor channel images + GOES-15 0.63 µm visible channel images

McIDAS images of GOES-15 6.5 µm water vapor channel data (prior to daylight) and then GOES-15 0.63 µm visible channel data after sunrise (above) on 14 November 2011 tell us one thing: this gravity wave was apparently fairly deep in the vertical, since it exibited a signal on both the water vapor channel imagery (which generally senses radiation from the middle troposphere: San Diego 12:00 UTC rawinsonde water vapor chanel weighting function profile) as well as on the lower-tropospheric cloud features seen on the visible channel imagery.

Note that there was a second packet of shorter-wavelength gravity waves that could be seen in the far southwestern portion of the GOES-15 visible image satellite scene toward the end of the animation. This second packet of gravity waves was very evident on a 500-meter resolution Aqua MODIS Red/Green/Blue (RGB) true color image at 21:21 UTC (below).

Aqua MODIS true color image

Aqua MODIS true color image

Gravity waves are usually ducted within a well-defined temperature inversion. A look at the 12:00 UTC rawinsonde profile from San Diego, California (below) did indicate the presence of a few inversions that might have been capable of ducting such a gravity wave — but the inversions existed at multiple levels.

San Deigo, California 12:00 UTC rawinsonde profile

San Deigo, California 12:00 UTC rawinsonde profile

An AWIPS image of 18:00 UTC MODIS 0.65 µm visible channel data with overlays of 1-hour interval MADIS satellite winds (below) did not reveal any atmospheric motion vectors with a southwesterly component – but these would likely have been rejected by the winds quality control algorithms, since such a motion would have differed too greatly from the model first guess wind fields at 850 hPa, 500 hPa, 300 hPa, and 250 hPa.

MODIS 0.65 µm visible channel image + MADIS 1-hour interval satellite winds

MODIS 0.65 µm visible channel image + MADIS 1-hour interval satellite winds

Regarding the effect of the gravity wave seen on the lower-tropospheric clouds bands, a MODIS 11.0 µm IR image detected cloud top IR brightness temperatures around +4ºC, which on a RUC model sounding at that location apparently corresponded to a cloud top height around 12,550 feet (below) — however, this value seemed to be a bit high judging from the appearance of the cloud band features on the GOES and MODIS visible and IR imagery.

MODIS 11.0 µm IR image + RUC model sounding

MODIS 11.0 µm IR image + RUC model sounding

On the other hand, POES AVHRR Cloud Type and Cloud Top Height products indicated that these low-level cloud bands were water droplet clouds, with cloud top heights of around 1 km (below) — much more typical for marine boundary layer cloud features over this region.

POES AVHRR Cloud Type product

POES AVHRR Cloud Type product

POES AVHRR Cloud Top Height product

POES AVHRR Cloud Top Height product

What the heck is this?

April 25th, 2011
GOES-13 6.5 µm "water vapor channel" images (click image to play animation)

GOES-13 6.5 µm "water vapor channel" images (click image to play animation)

We received the following in an email message from Paul Fuentes at the National Weather Service forecast office at Key West, Florida:

“Just though you might be interested in a peculiar little feature we noticed at the WFO Key West on AWIPS from GOES-13 IR imagery on 4/23/11 starting at about 22:301Z over Andros Island (24.21N, 77.7W) and persisted to into the afternoon on 4/24/11. The feature looked almost like a smoke ring (several miles across) that was drifting off to the Northeast that emanated off of Andros Island and was also apparent in VIS/WV.”

McIDAS images of 4-km resolution GOES-13 6.5 µm “water vapor channel” data (above) showed the feature in question, as it first appeared along the east coast of Andros Island (the large island in the lower left corner of the images) at 22:45 UTC on 24 April 2011 — and then propagated northeastward, grew in size, exhibited progressively colder brightness temperatures, and at times took on a ring-like shape.

A closer look using 1-km resolution GOES-13 0.63 µm visible channel images (below) again revealed the ring-like structure that was evident at various times during the day on 25 April 2011.

GOES-13 0.63 µm visible channel images (click image to play animation)

GOES-13 0.63 µm visible channel images (click image to play animation)

The feature (as seen on 10.8 µm POES AVHRR IR imagery, below) seemed to follow the CRAS model 300 hPa wind flow — and southwesterly winds were not found until the 375 hPa pressure level on the 12 UTC rawinsonde report from Nassau in the Bahamas.

POES AVHRR 10.8 µm IR images + CRAS model 300 hPa wind flow

POES AVHRR 10.8 µm IR images + CRAS model 300 hPa wind flow

A comparison of the MODIS 0.65 µm visible channel, the 11.0 µm IR window channel, the 6.7 µm water vapor channel, and the 1.3 µm cirrus detection channel images at 15:57 UTC (below) seem to support the idea that this was a high ice cloud feature.

MODIS visible, IR window, water vapor, and cirrus detection channel images

MODIS visible, IR window, water vapor, and cirrus detection channel images

So what exactly was this interesting satellite feature? Until an explanation is found, this blog posting shall remain in the “What the heck is this?” Category…