Lake-Effect Snow over North Dakota
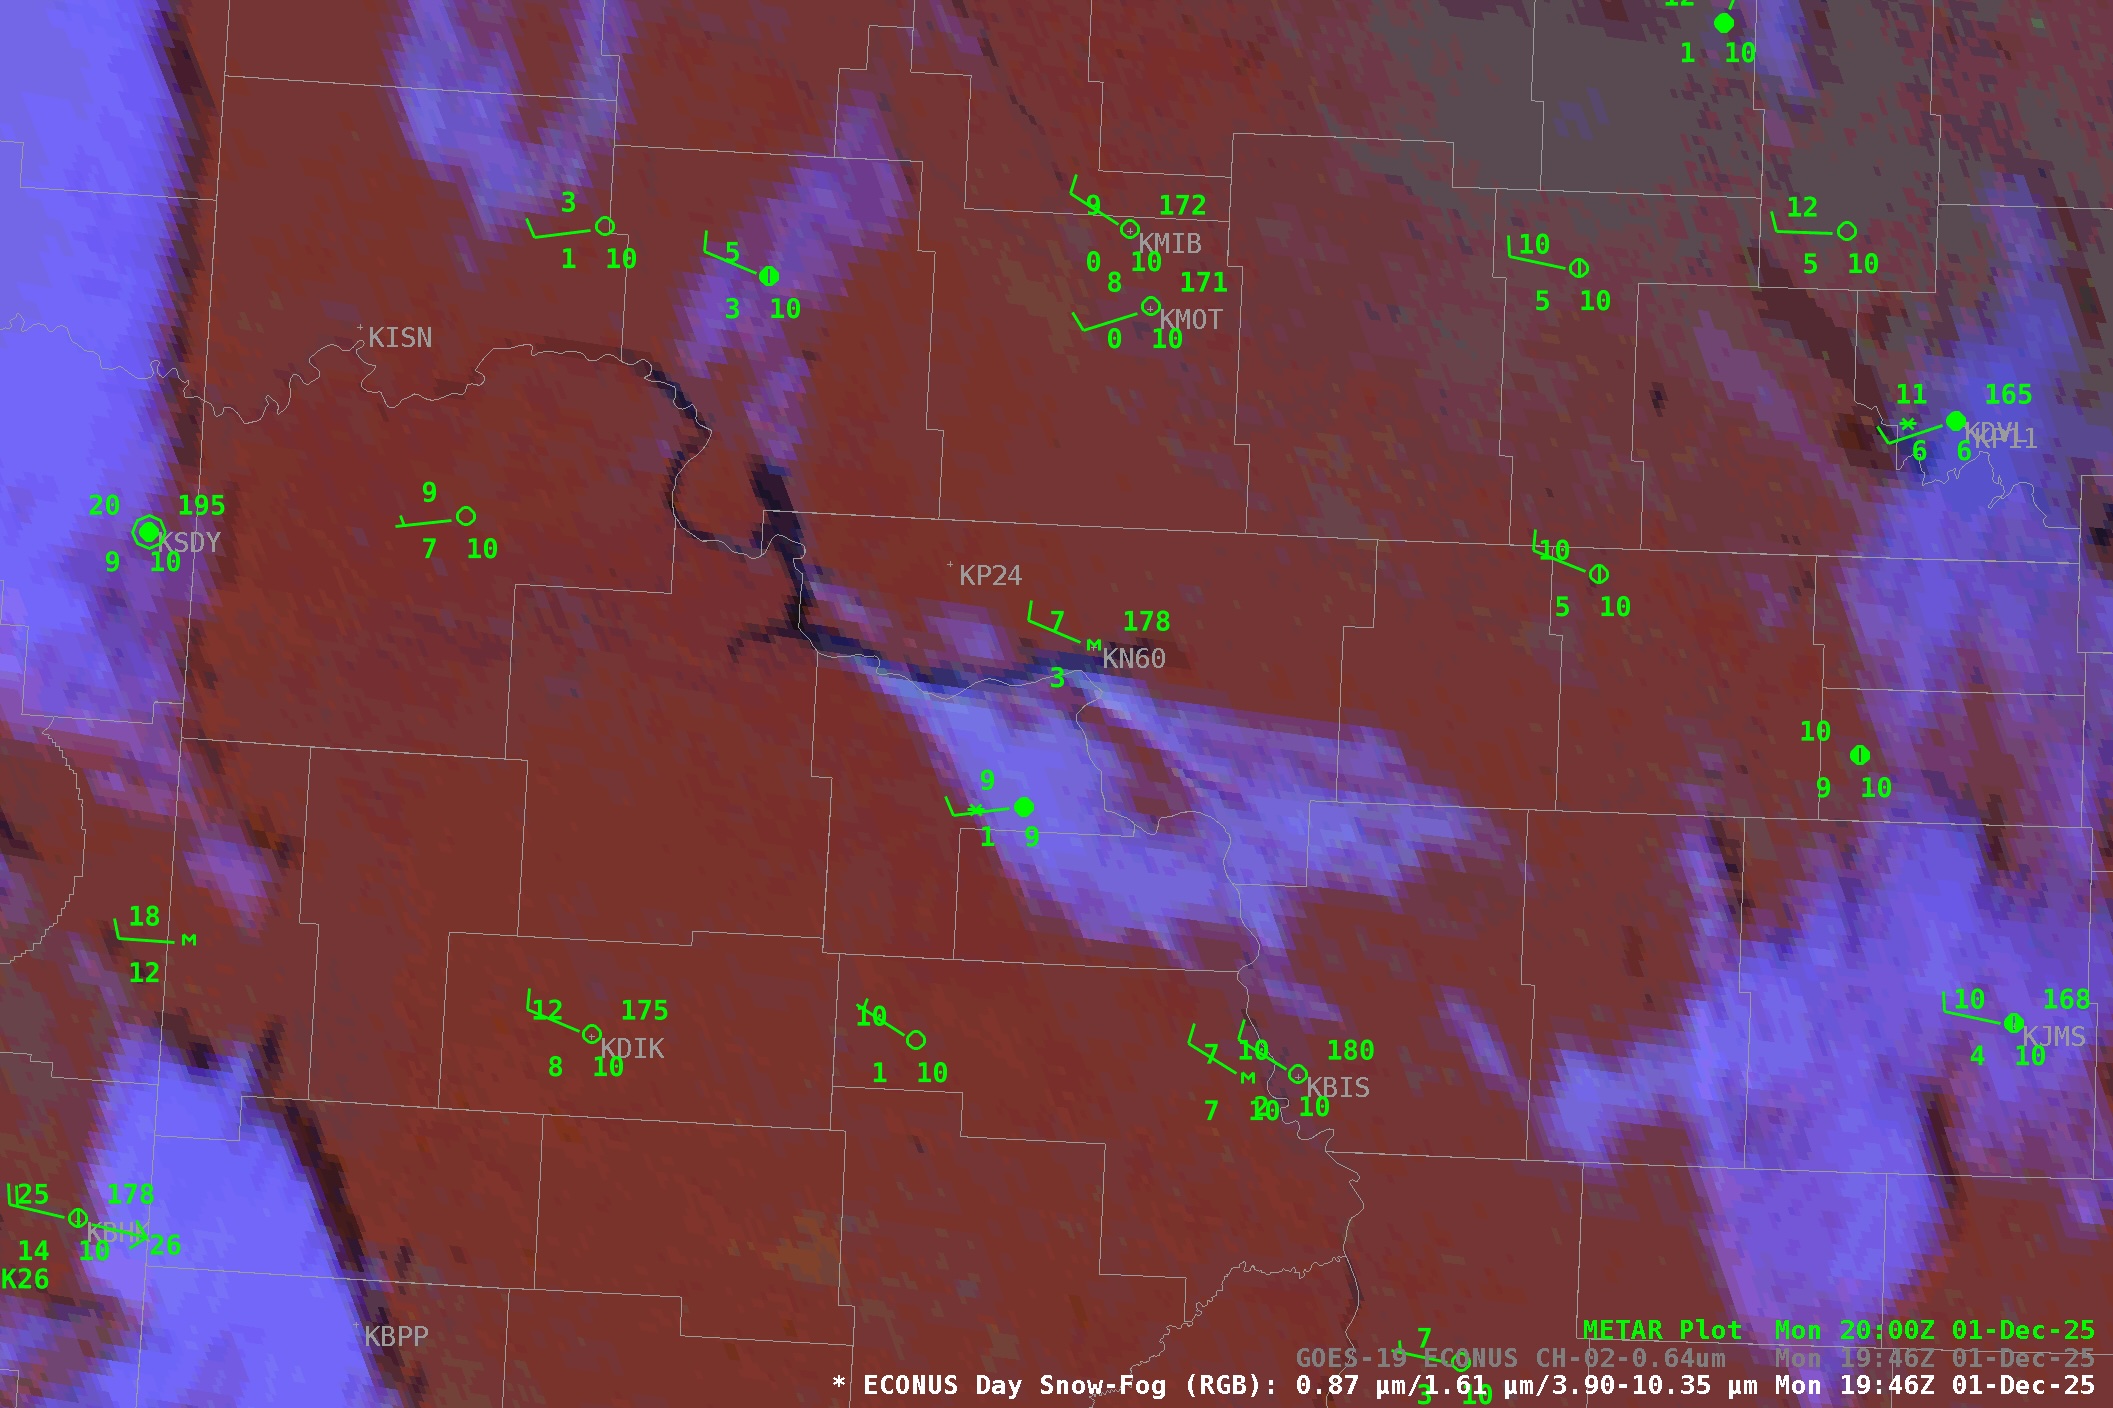
When you hear about the lake effect, you almost always think about the Great Lakes, whose impacts on local weather and climate are well-known across the upper Midwest and into the northeast. It may, then, seem odd to consider a lake effect event in North Dakota. However, if conditions are... Read More