Using McIDAS-V to display GOES-16 FDCA fields
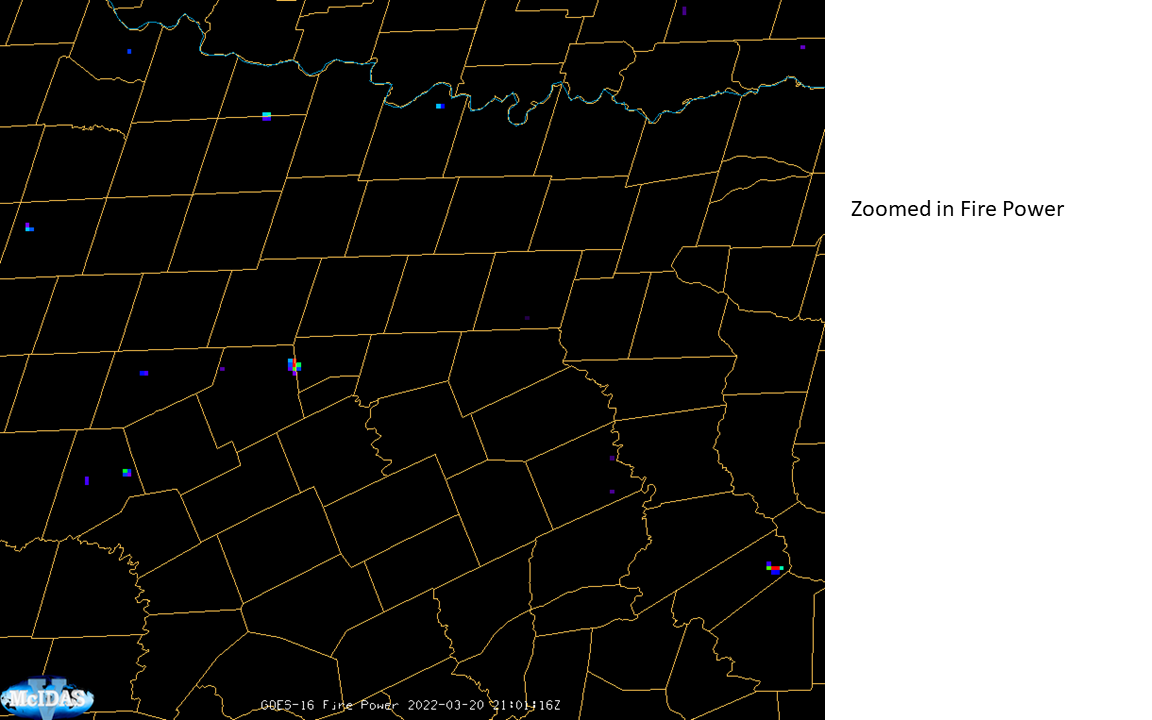
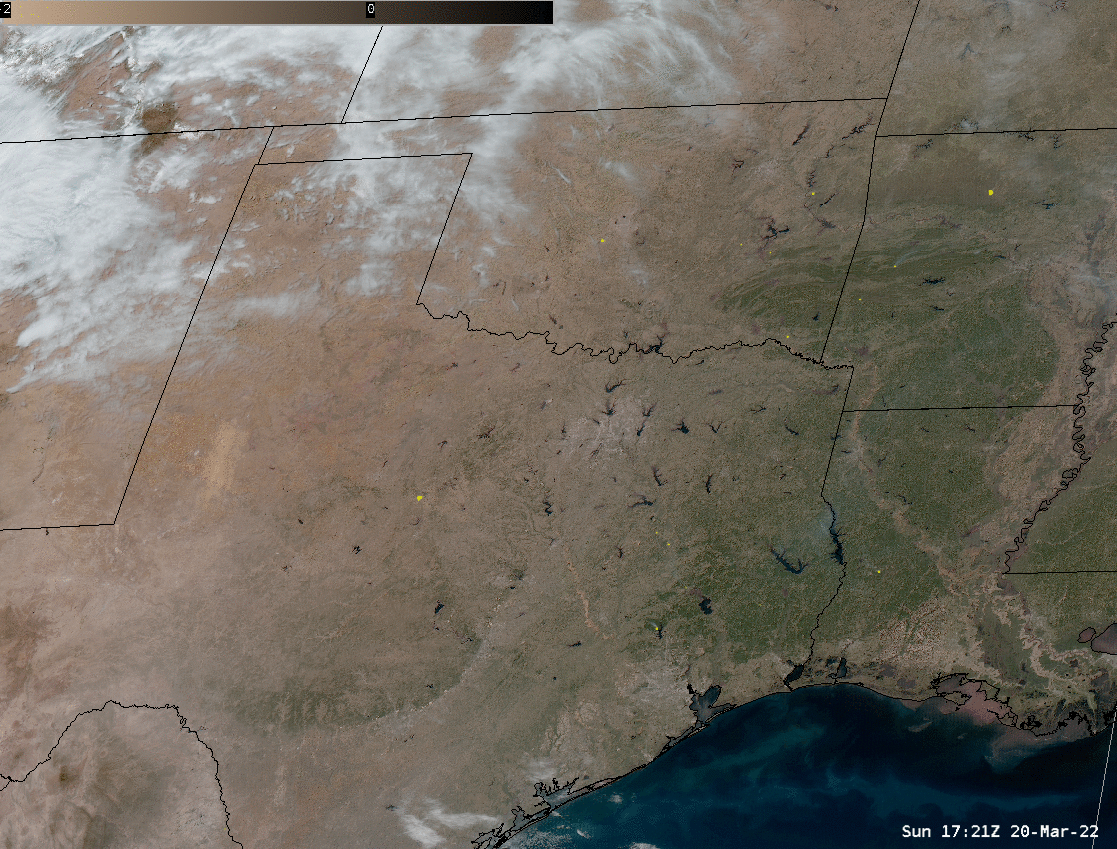
The image below shows GOES-16 Fire Power, a Fire Detection/Characterization Algorithm (FDCA) output field (along with Fire Temperature and Fire Area), on a day when strong southerly winds helped support multiple fires over Texas (as shown in this animation, from this blog post). If you do not have access to AWIPS, as below... Read More
