Northeast US heavy rain and high wind event
![GOES-16 Mid-level Water Vapor (6.9 µm) images, with hourly precipitation type symbols plotted in red [click to play MP4 animation]](https://cimss.ssec.wisc.edu/satellite-blog/wp-content/uploads/sites/5/2017/10/960x1280_AGOES16_B9_G16_WV_B9_NEUS_LARGE_30OCT2017_2017303_002221_0001PANEL.GIF)
GOES-16 Mid-level Water Vapor (6.9 µm) images, with hourly precipitation type symbols plotted in red [click to play MP4 animation]
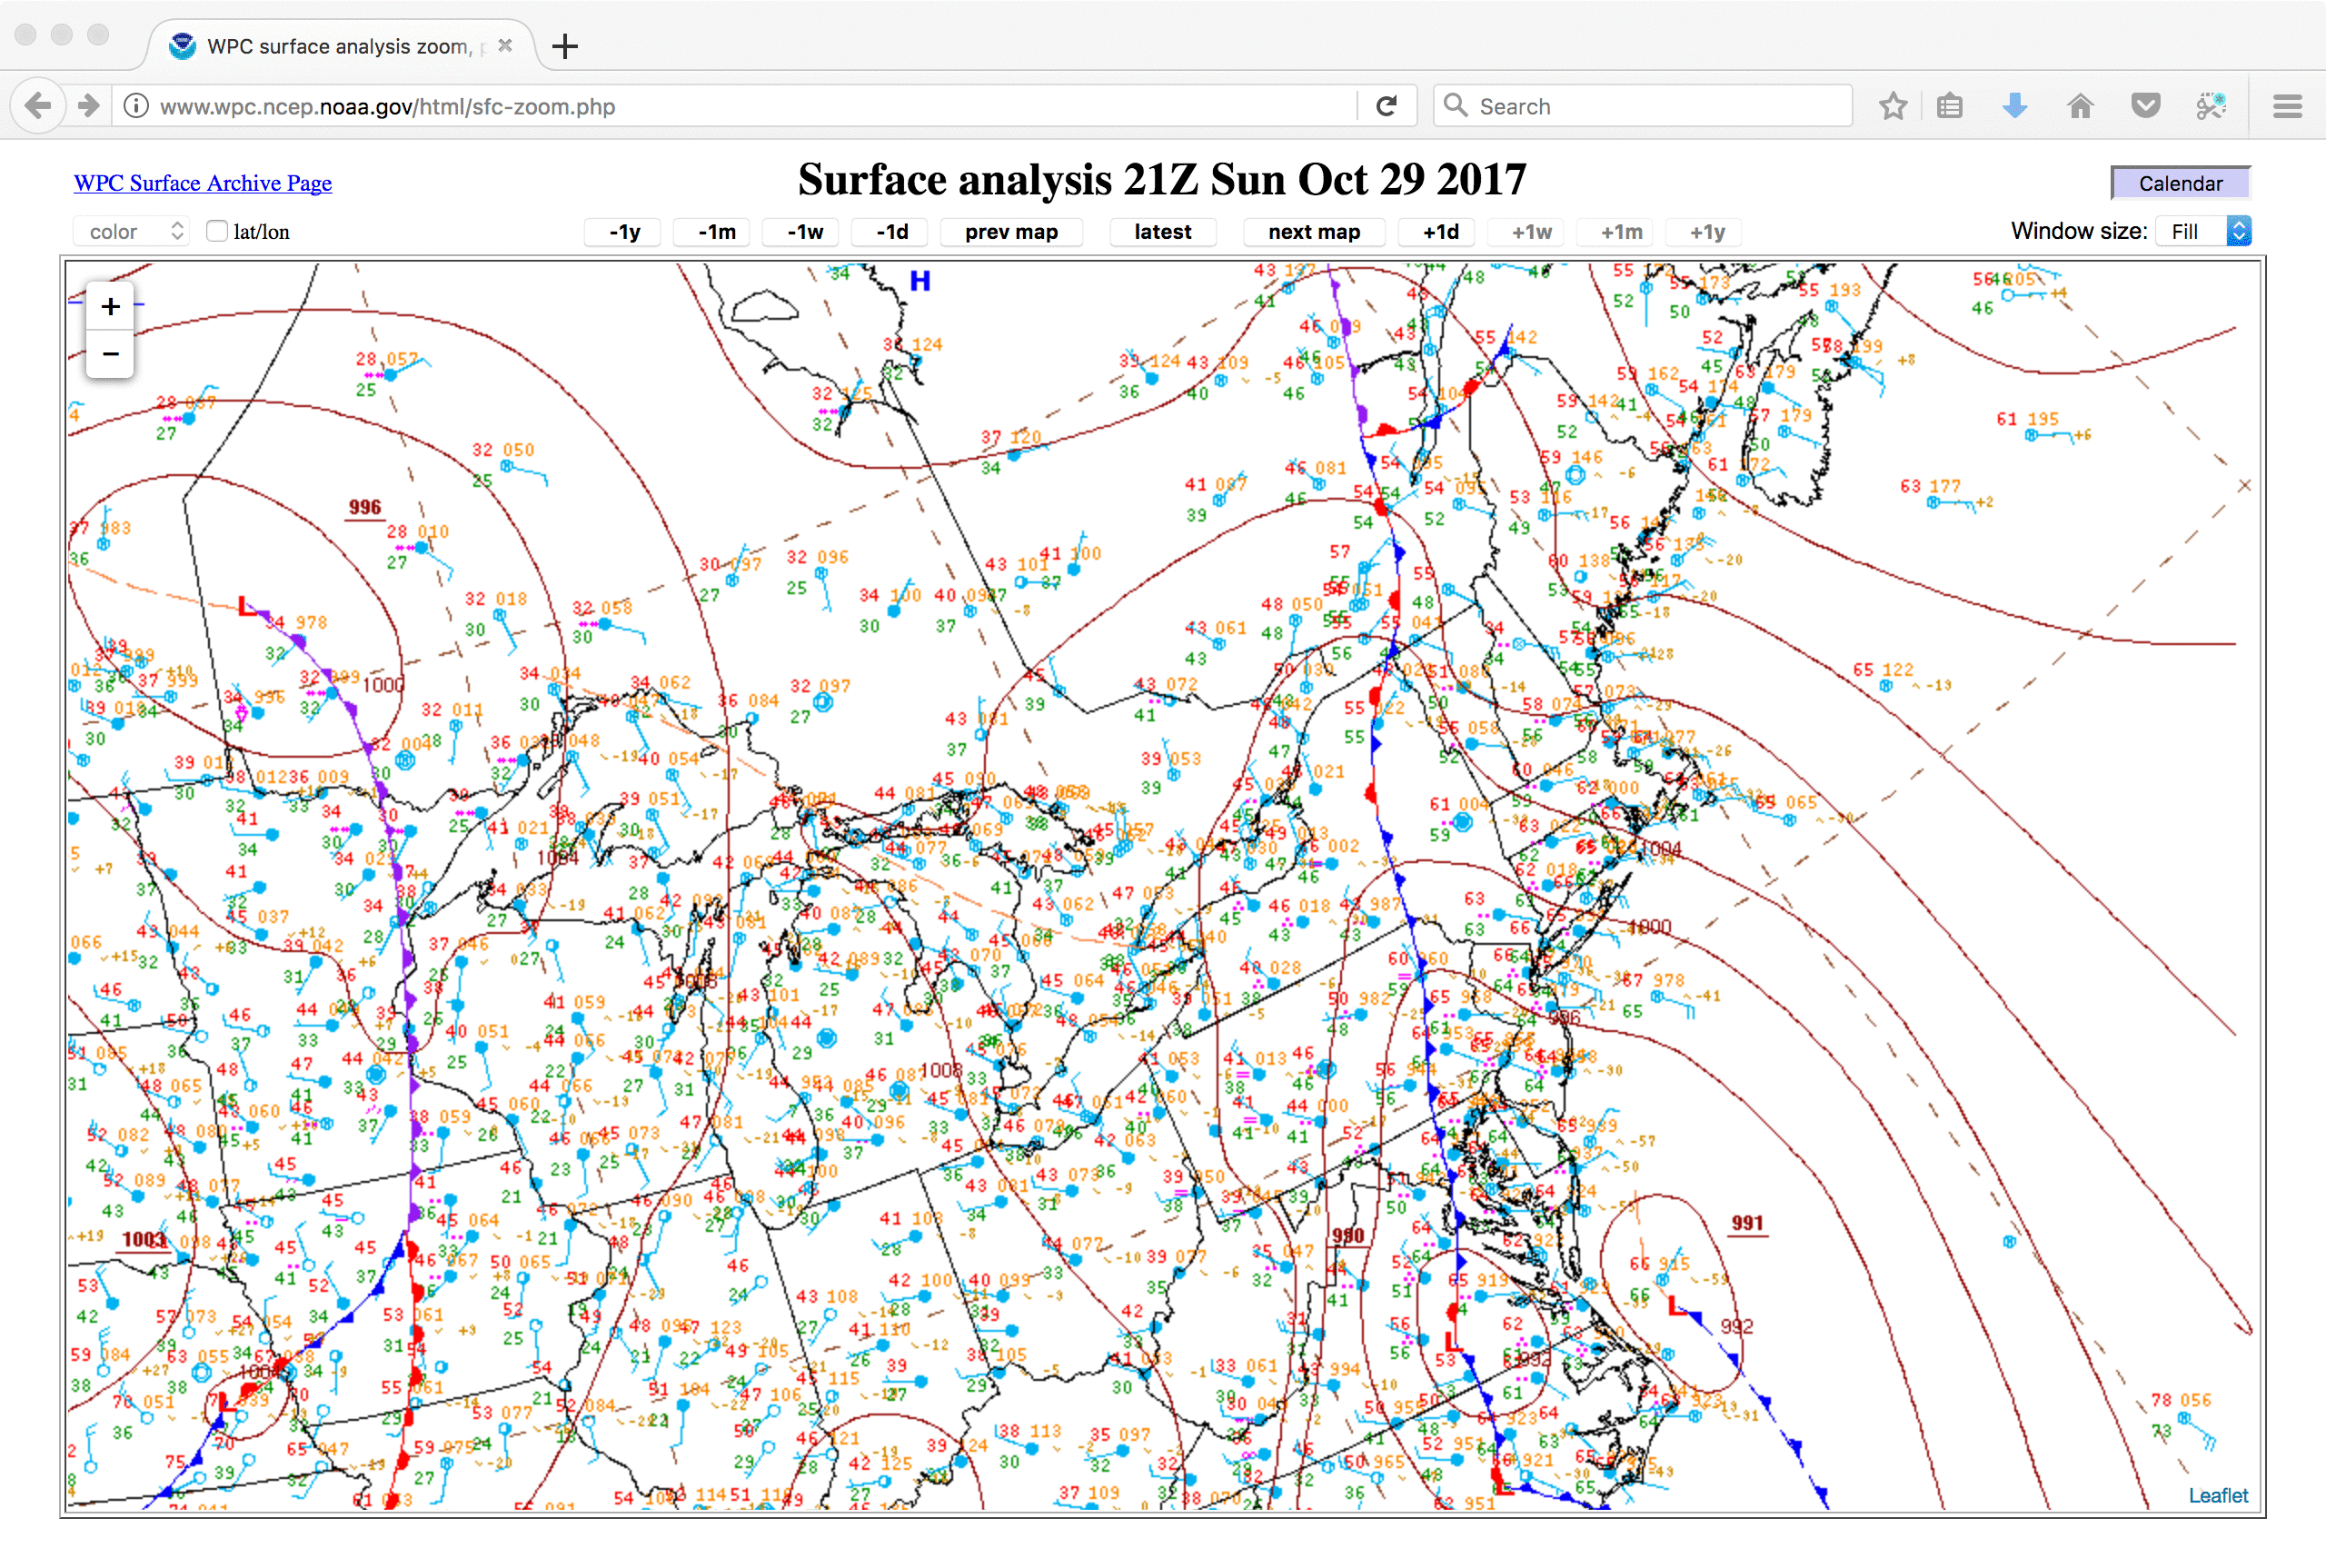
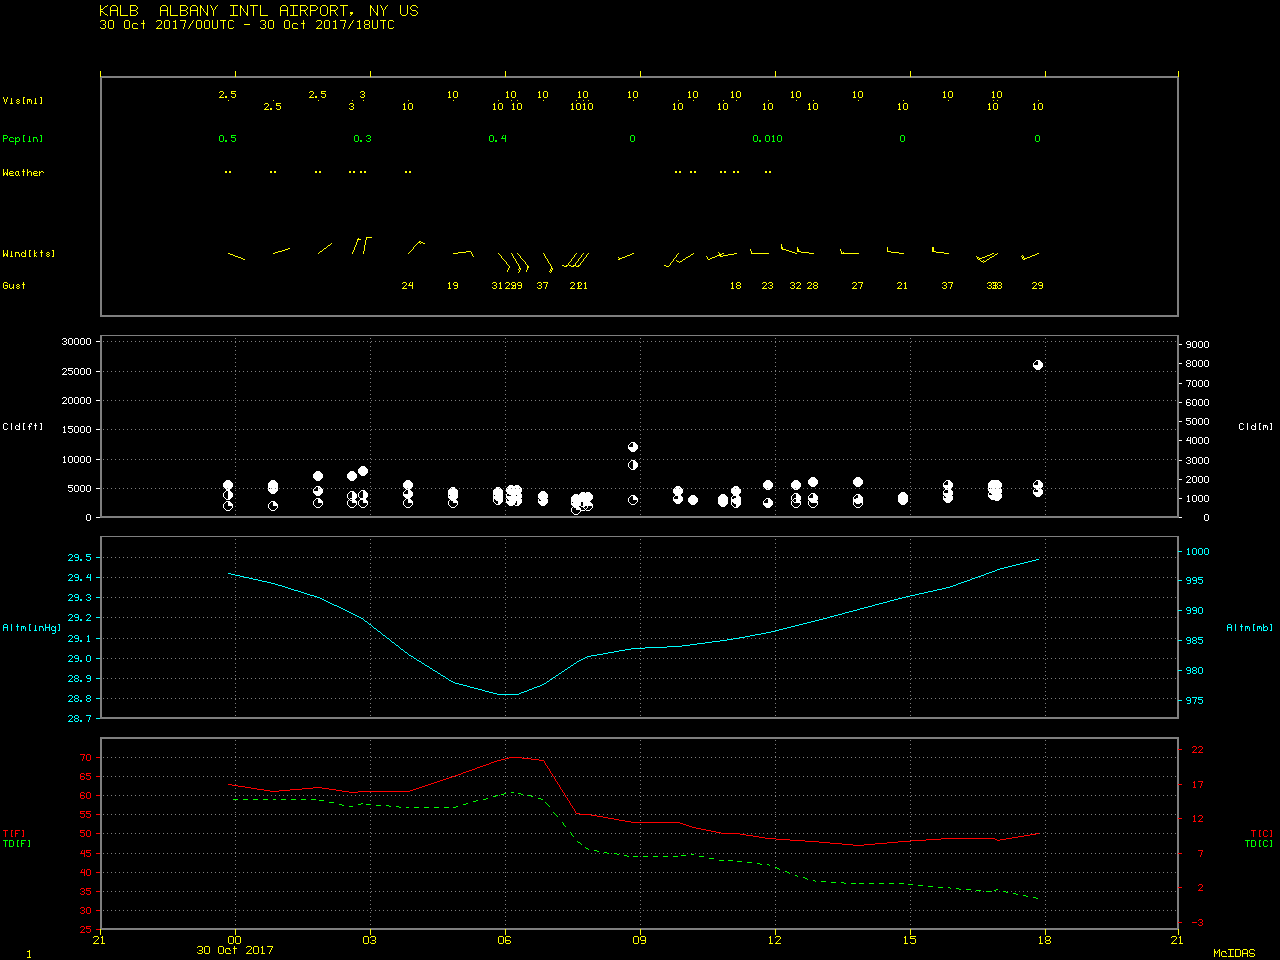
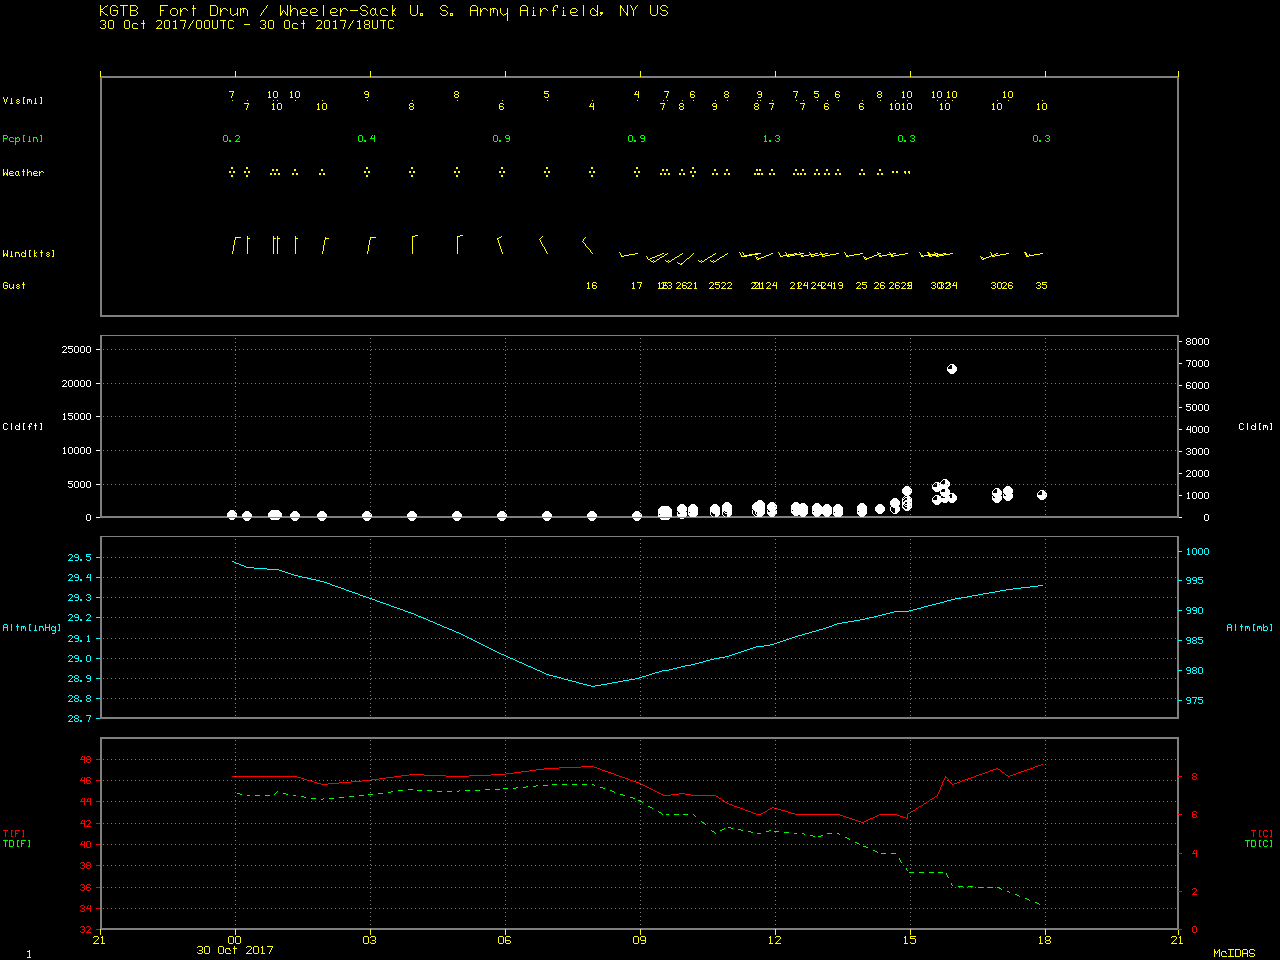
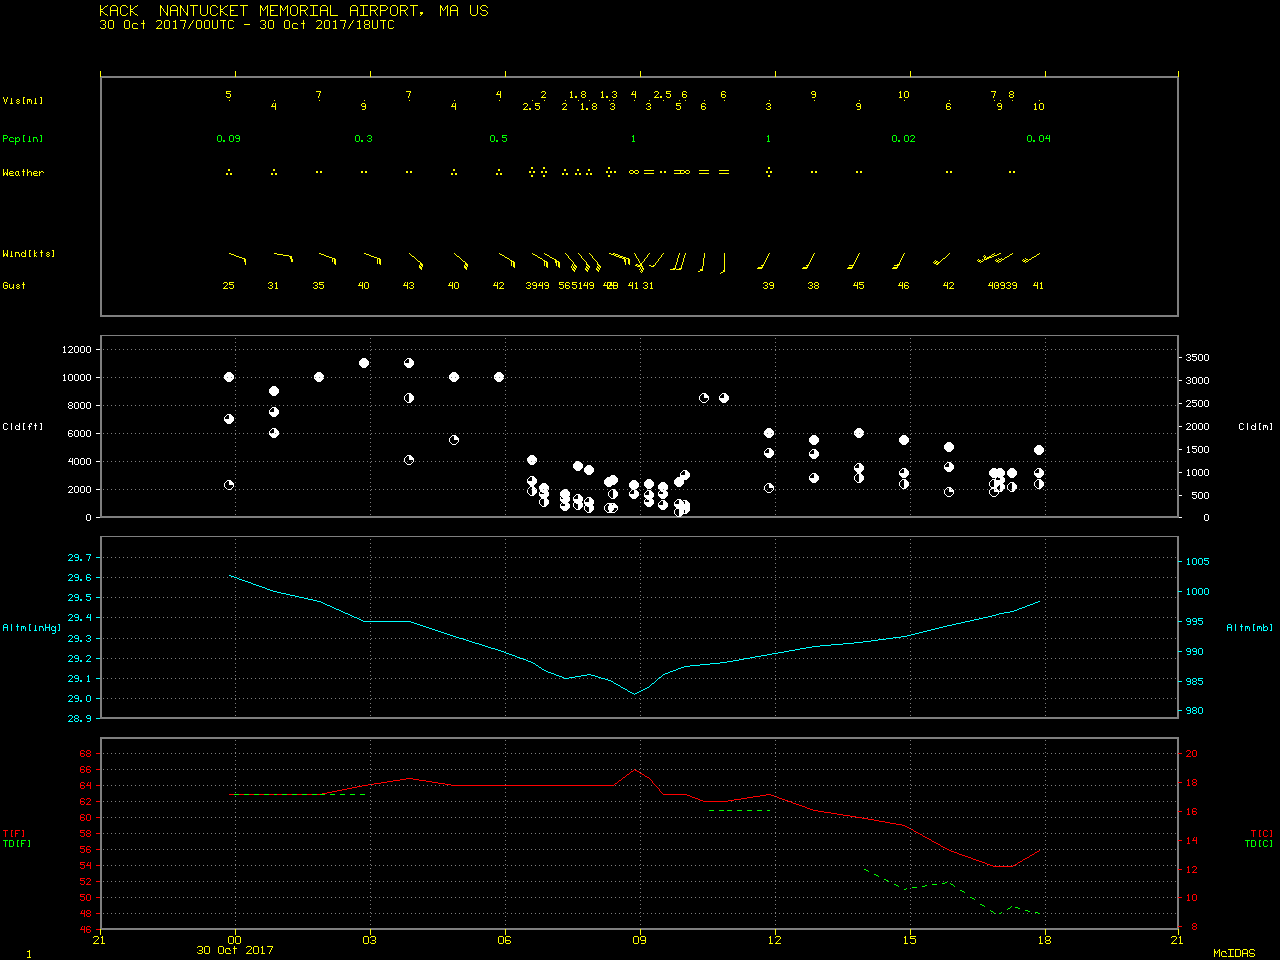
GOES-16 Mid-level Water Vapor (6.9 µm) images with hourly surface weather symbols plotted in red (above) showed the large-scale evolution of a storm system that deepened rapidly as it moved across the Northeast US during the 29 October – 30 October 2017 period (surface analyses). This storm produced widespread high winds and heavy rain (WPC storm summary | NWS Boston PNS | NWS Caribou PNS). Record low sea level pressures for the month of October were set in New York at Albany (977.7 hPa) and Fort Drum (977.5 hPa), and in Massachusetts at Nantucket (982.6 hPa) — a map of the minimum sea level pressures from the New York State Mesonet can be seen here.
Closer views of the Northeast US using images from the GOES-16 Upper-level Water Vapor (6.2 µm), Mid-level Water Vapor (6.9 µm) and Low-level Water Vapor (7.3 µm) bands are shown below, with hourly surface wind gusts (knots) plotted in red. The high winds caused extensive damage to trees and power lines, leading to power outages in some areas — and also contributed to coastal storm surge.
![GOES-16 Upper-level Water Vapor (6.2 µm) images, with hourly surface wind gusts (in knots) plotted in red [click to play MP4 animation]](https://cimss.ssec.wisc.edu/satellite-blog/wp-content/uploads/sites/5/2017/10/960x1280_AGOES16_B8_G16_WV_B8_NEUS_30OCT2017_2017303_022221_0001PANEL.GIF)
GOES-16 Upper-level Water Vapor (6.2 µm) images, with hourly surface wind gusts (in knots) plotted in red [click to play MP4 animation]
![GOES-16 Mid-level Water Vapor (6.9 µm) images, with hourly surface wind gusts (in knots) plotted in red [click to play MP4 animation]](https://cimss.ssec.wisc.edu/satellite-blog/wp-content/uploads/sites/5/2017/10/960x1280_AGOES16_B9_G16_WV_B9_NEUS_30OCT2017_2017303_022221_0001PANEL.GIF)
GOES-16 Mid-level Water Vapor (6.9 µm) images, with hourly surface wind gusts (in knots) plotted in red [click to play MP4 animation]
![GOES-16 Lower-level Water Vapor (7.3 µm) images, with hourly surface wind gusts (in knots) plotted in red [click to play MP4 animation]](https://cimss.ssec.wisc.edu/satellite-blog/wp-content/uploads/sites/5/2017/10/960x1280_AGOES16_B10_G16_WV_B10_NEUS_30OCT2017_2017303_022221_0001PANEL.GIF)
GOES-16 Lower-level Water Vapor (7.3 µm) images, with hourly surface wind gusts (in knots) plotted in red [click to play MP4 animation]
![850 hPa Relative Vorticity product [click to play animation]](https://cimss.ssec.wisc.edu/satellite-blog/wp-content/uploads/sites/5/2017/10/171029-30_850hPa_relative_vorticity_anim.gif)
850 hPa Relative Vorticity product [click to play animation]