Probabilities, Uncertainties & Units Used to Quantify Climate Change  Activities
How does the IPCC know whether the statement about global warming's cause is virtually certain, extremely likely, very likely, or likely? In order to consistently, across many different disciplines, quantify uncertainty and communicate findings to the public, the IPCC conveys statistical data via a "Likelihood" scale to effectively communicate what we know (and don't know) about global climate change.
|
|
|
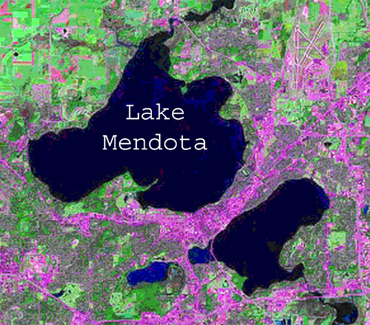
In this activity, you will use statistics to analyze a 160 year dataset from Lake Mendota in Madison Wisconsin reflecting seasonal ice cover. Every year, since 1855, someone has recorded when the lake froze (ice on), and when the lake thawed (ice off). You'll use these data to ask, 'Is ice off date on Lake Mendota in recent decades statistically different (earlier) than the first two decades of observed ice cover?' To answer this question and at the same time quantify the uncertainty around the answer, you will use one of the "t-test", a basic and relatively simple statistical technique. |
To get started, download these detailed instructions and worksheet (Word Document, PDF) before using the webapp below to compare sucessive 20-year columns of ice-off data.
Lake Mendota Ice-off Data & WebApp
Select any two columns then click "Calculate"
Optional 1-page classroom worksheet.