
A strong cold front moved southward over the High Plains of the US on Monday 10 November, and the strong winds produced a dust cloud that was apparent in GOES-13 visible imagery, above. The leading edge of the dust cloud in the satellite imagery indicated precisely the leading edge of... Read More
GOES-13 0.63 µm Visible imagery (click to play animation)
A strong cold front moved southward over the High Plains of the US on Monday 10 November, and the strong winds produced a dust cloud that was apparent in GOES-13 visible imagery, above. The leading edge of the dust cloud in the satellite imagery indicated precisely the leading edge of the cold front. The animation below shows hourly observations plotted on top of the GOES-13 visible imagery. The correspondence between the leading edge of the dust and the wind shift is obvious. Note that multiple stations report Haze (H) after the wind shift occurs.
GOES-13 0.63 µm Visible imagery and surface observations (click to play animation)
GOES-15 viewed this event as well (Visible animation; Visible animation with observations). The dust in the atmosphere was far more apparent in the GOES-13 imagery, however. This case is an excellent demonstration of how dust effectively forward scatters visible light from the setting sun towards GOES-13 at 75º W, but does not so effectively back scatter towards GOES-15 at 135º W. The toggle below shows visible imagery from GOES-13 and GOES-15, both at 2200 UTC.

GOES-13 0.63 µm Visible imagery and GOES-15 0.62 µm Visible Imagery, both at 2200 UTC 10 November (click to enlarge)
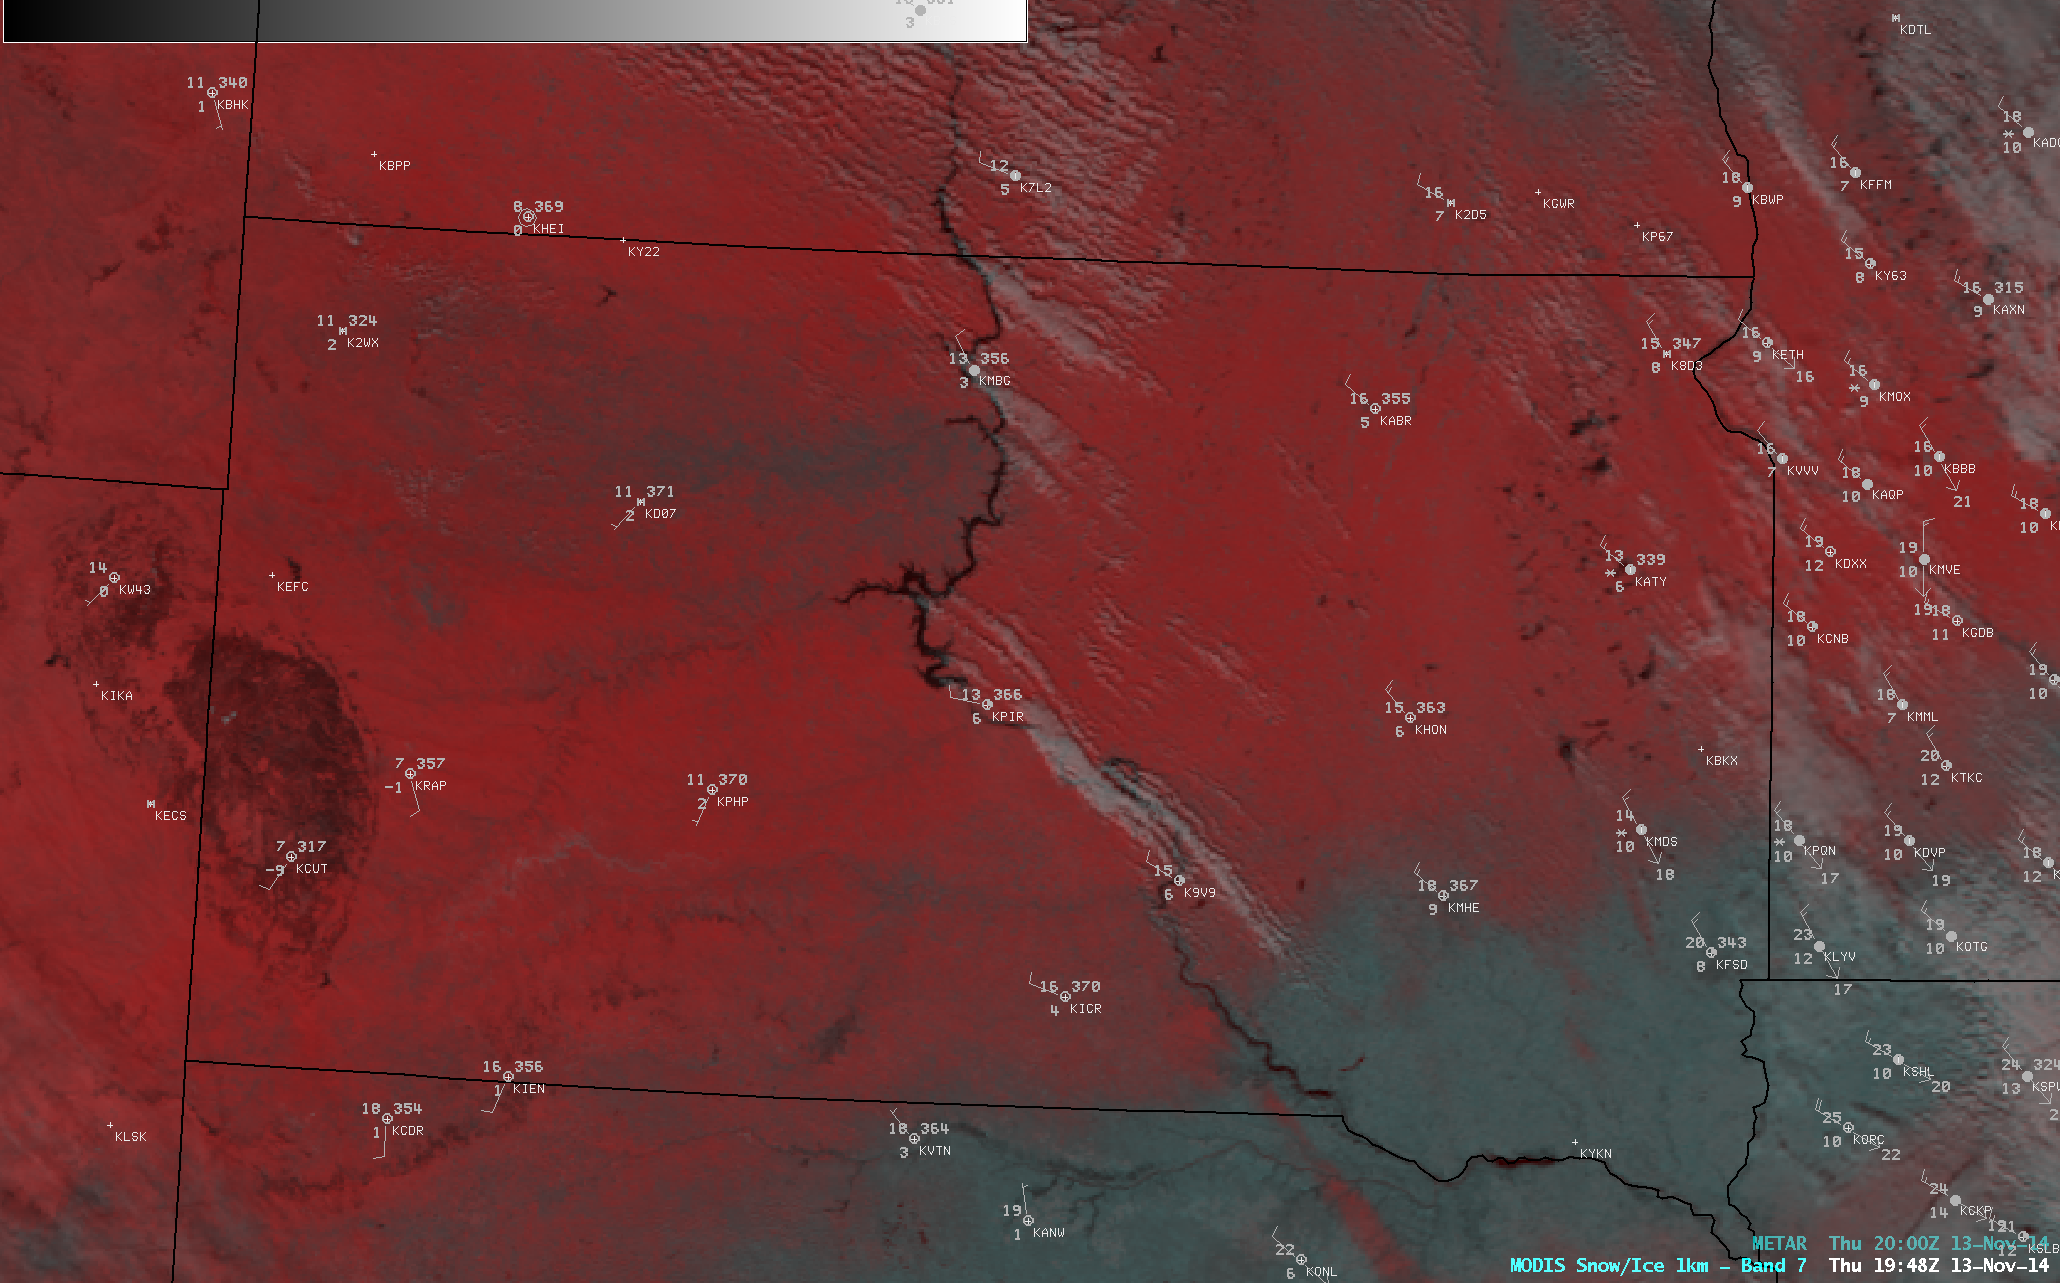
Both Aqua (MODIS) and Suomi NPP (VIIRS) viewed this haboob in mid-afternoon on 10 November. What can the multispectral views of this feature tell us? Both the Visible and Snow/Ice channels give similar views of the leading edge of the cold front (the biggest difference between the visible and snow/ice channel in this image is that water features are so much darker in the snow/ice channel because water strongly absorbs 2.1 µm radiation; differences in the clouds between the visible and the snow/ice (2.1 µm) channel arise from viewing water-based vs. ice-based clouds). The cirrus channel — 1.37 µm — does not see the surface but it does clearly reveal high clouds. The 3.9-µm image — shortwave infrared — shows very warm temperatures right at the leading edge of the cold front in eastern Colorado. This is a region where the dust is effectively reflecting solar radiation. The longwave infrared imagery (10.7 µm) shows a more uniform cold edge to the cloud. Finally, even the water vapor imagery shows a signal from this cold front (known as a lee-side frontal gravity wave). It is unusual for surface features to have a signal in water vapor imagery; when it does occur, the atmosphere is usually very dry, and that’s the case in this event. Note in the toggle here between GOES water vapor channel weighting functions (computed here) at Amarillo between 0000 UTC — before the cold front — and 1200 UTC — after the cold front — shows how the layer from which 6.5 µm radiation will be detected has dropped in altitude.
Aqua MODIS Visible, Snow/Ice, Cirrus, Shortwave IR, Water Vapor and Longwave IR Imagery at 1917 UTC, 10 November (click to enlarge)
Suomi NPP viewed the cold front 10 minutes before Aqua, below, and also about 90 minutes later (Favorable orbital geometry allowed sequential orbits to view eastern Colorado). The shortwave IR (3.74 µm) show warmer signatures in some of the dust plumes compared to the longwave IR (11.35 µm), similar to Aqua, a difference that is likely due to solar radiation being reflected by the dust.
Suomi NPP VIIRS data showing Visible, Day Night Band, Snow/Ice, Shortwave IR, and Longwave IR Imagery at 1907 UTC, 10 November (click to enlarge)
Suomi NPP VIIRS data showing Visible, Day Night Band, Snow/Ice, Shortwave IR, and Longwave IR Imagery at 2049 UTC, 10 November (click to enlarge)
Animations of 10.7 µm Brightness Temperature Data from GOES-13 showed the southward plunge of cold air overnight. The progress of this cold front could be monitored from space. Even the water vapor imagery continued to include a signature of the cold front.
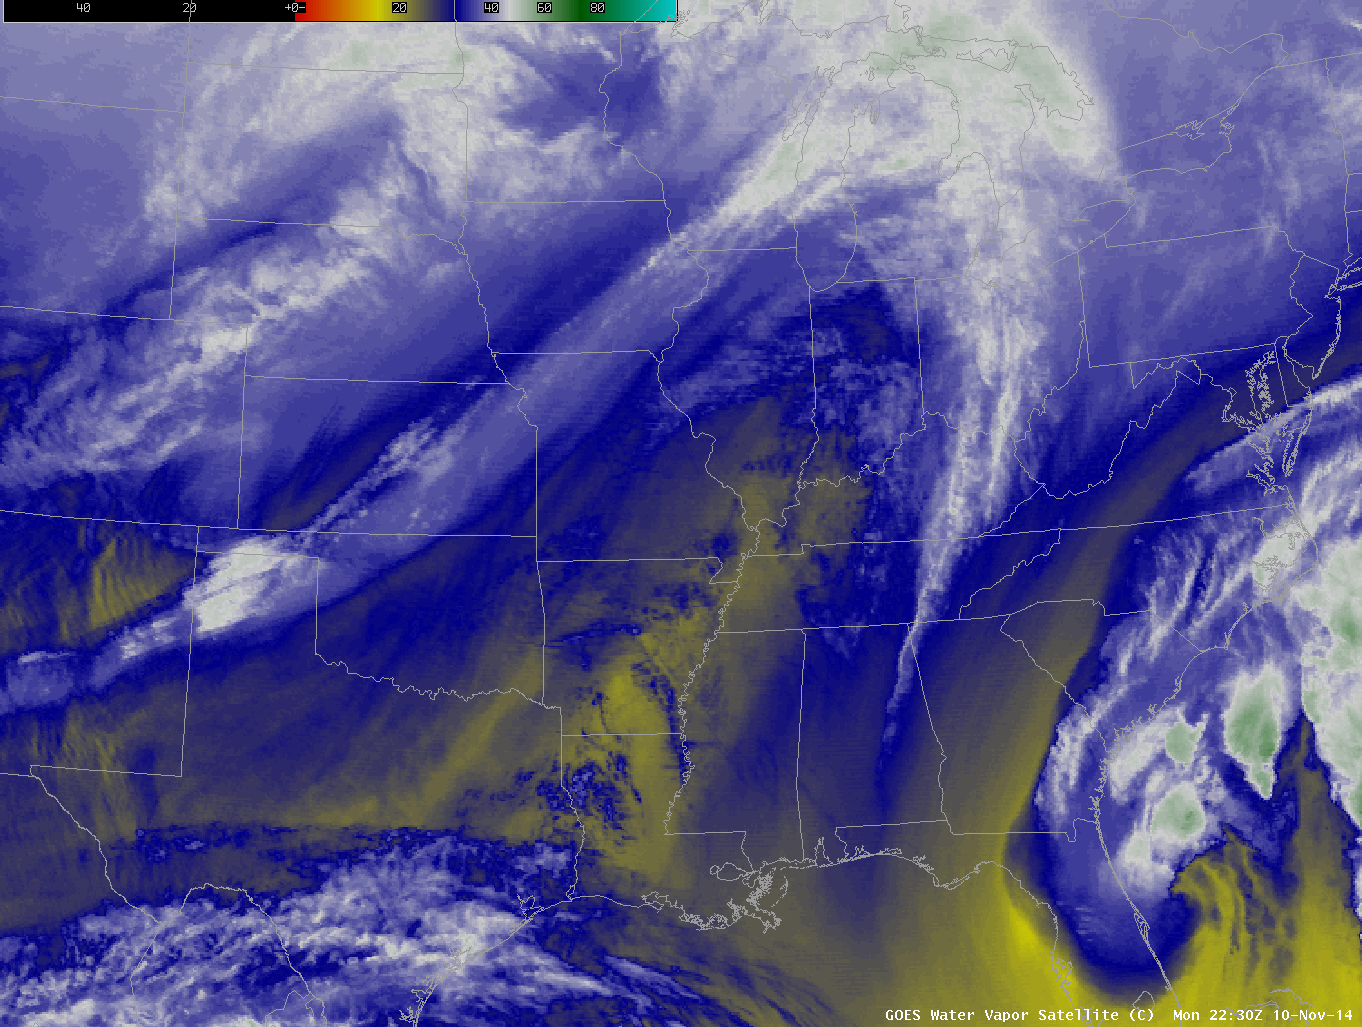
GOES-13 Water Vapor (6.7 µm) Infrared Imagery (click to play animation)
The visible imagery at the top of this post ably captured the signature associated with blowing dust. Did the blowing dust continue through the night? Single-channel detection of dust at night is difficult. Historically, dust could be detected with brightness temperature differences between 10.7 µm and 12 µm channels on the GOES Imager, but that capability ended when the 13.3 µm channel replaced the 12 µm channel on the GOES Imager (the GOES-R ABI will contain a 12 µm channel). The VIIRS Day Night Band, below, from Suomi NPP at 0905 UTC on 11 November, does not show a distinct dust signature over south Texas. The leading edge of the front is obvious, however, as it is preceded by a Bore structure with parallel lines of clouds.
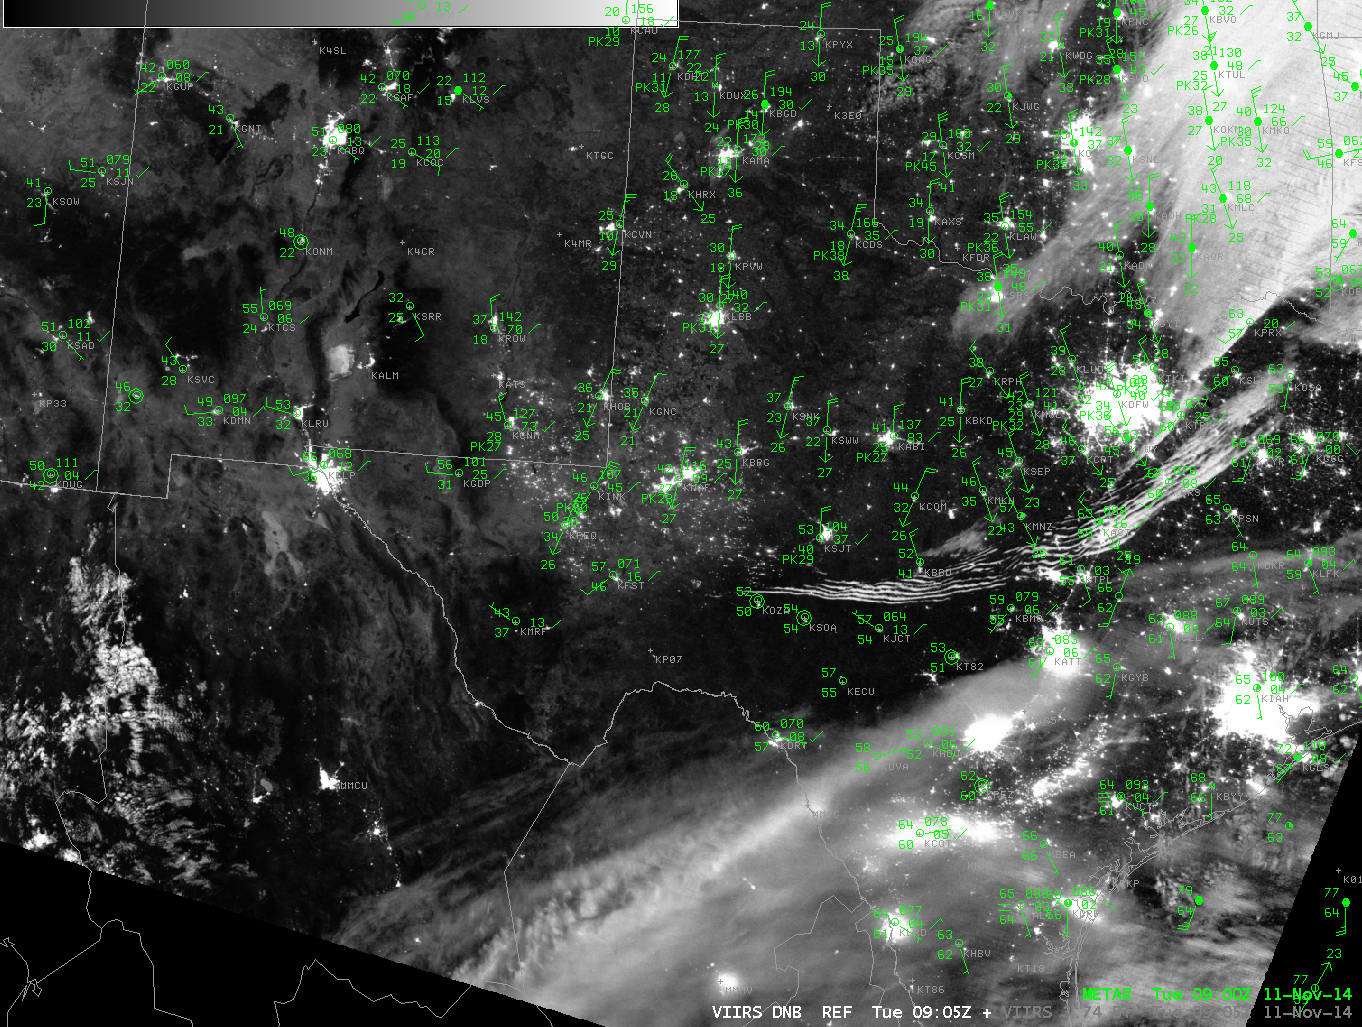
Suomi NPP VIIRS Day Night Band (.7 µm) Visible Imagery at 0905 UTC 11 November 2014 (click to enlarge)
View only this post
Read Less


