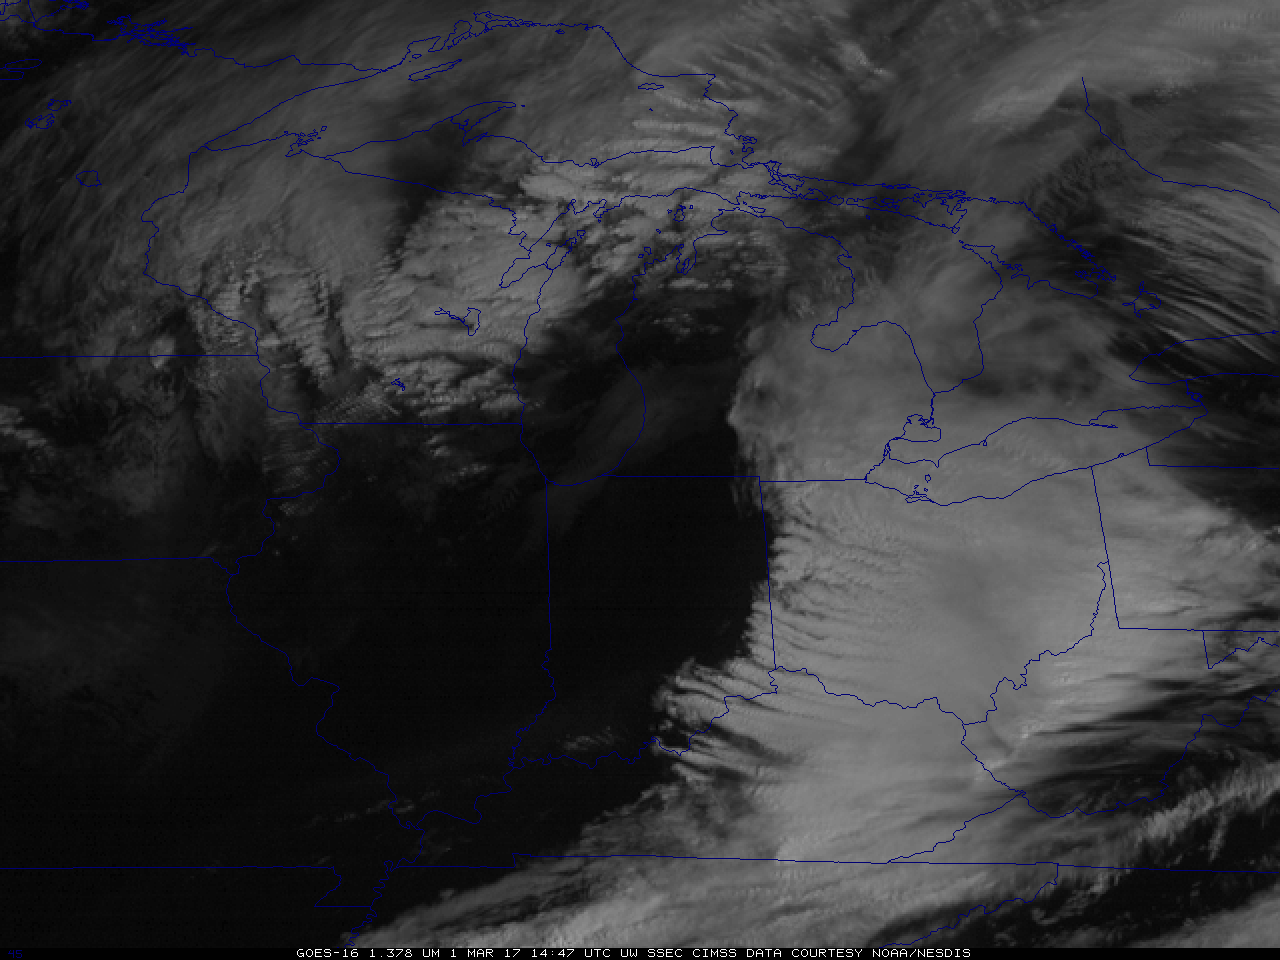

GOES-16 Band 4 (1.37 µm) Imagery from 1236-1406 UTC on 1 March 2017 [click to animate]
Note: GOES-16 data shown on this page are preliminary, non-operational data and are undergoing on-orbit testing.
The Advanced Baseline Imager (ABI) on the GOES-R Series of satellites (including GOES-16) includes a band that detects radiation at 1.37 µm (Fact Sheet Link). This 2-km resolution band is unique to GOES-16 among geostationary satellites. The animation above shows a subset of Full-Disk imagery at 15-minute intervals (GOES-16 produces a full disk every 15 minutes, in contrast to GOES-13/GOES-15’s 3-hour Full Disk cadence). The Cirrus channel highlights only the highest clouds associated with the wave cyclone over the central part of the United States. Clouds are not initially obvious early in the animation over the northern Plains: this band detects reflected solar radiation and therefore gives little information at night.
The Band 4 Cirrus Channel to the Band 2 visible (0.64 µm) toggle, below, enables an observer to distinguish between low/middle cloud levels and high clouds quite easily. Water vapor in the atmosphere above the low clouds in Illinois and Missouri (and elsewhere) is absorbing any reflected radiation at 1.37 µm there. If precipitation is being produced by a seeder/feeder mechanism, the presence of high clouds as detected in the Cirrus channel could help refine analyses of falling precipitation.
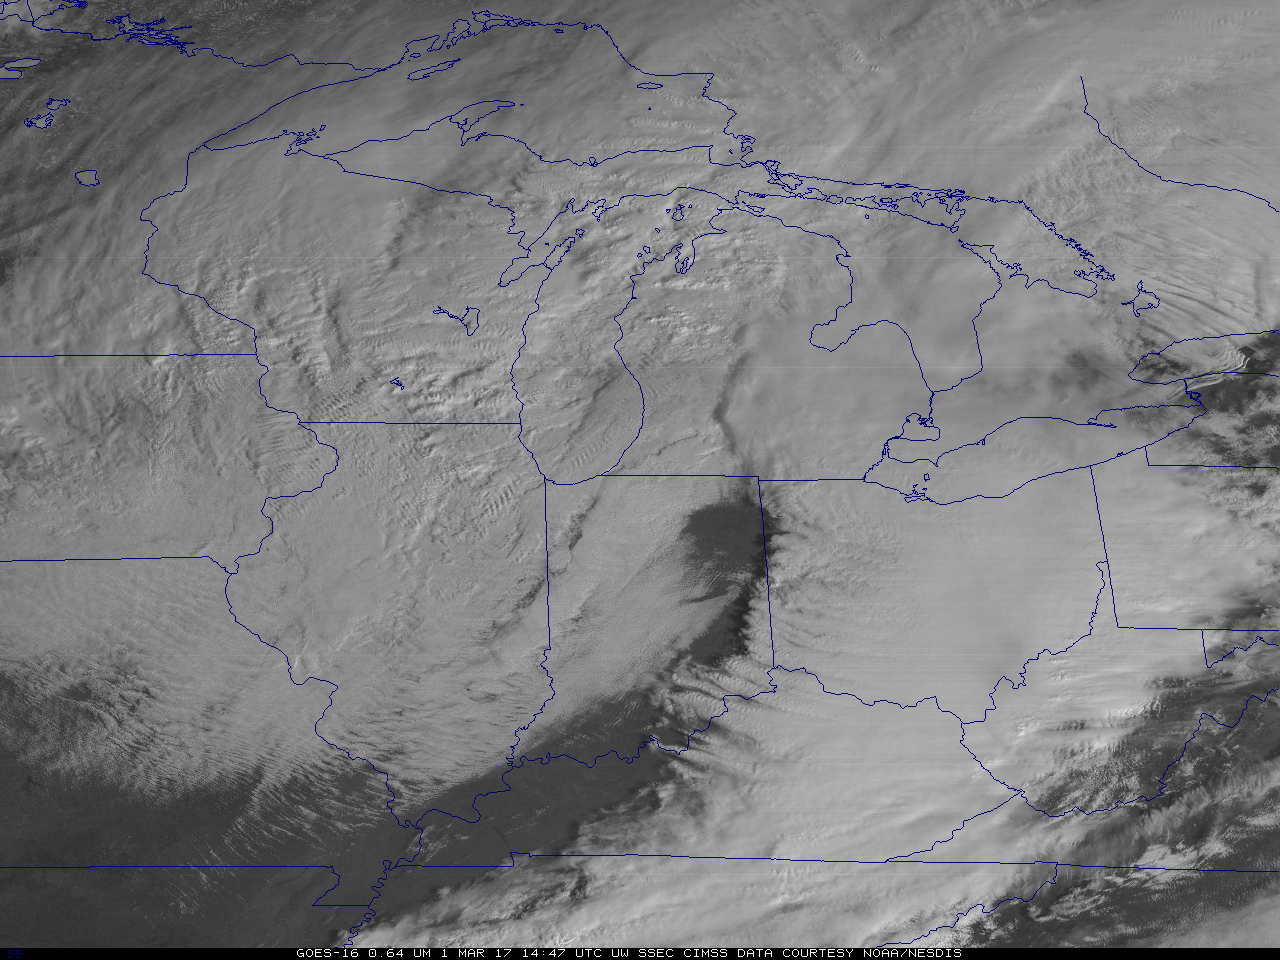
GOES-16 Band 2 (0.64 µm) and Band 4 (1.37 µm) Imagery from 1447 UTC on 1 March 2017 [click to enlarge]
A similar band (with 1-km resolution) is present on Terra and Aqua as part of MODIS and there are numerous CIMSS Satellite Blog Posts that incorporate snapshots from this MODIS cirrus-detection channel: Detecting thin cirrus and contrails over Arkansas and Tennessee; Thin Cirrus over the Midwest; Cirrus associated with Haloes; The Cirrus Canopy of Hurricane Matthew; Transverse Banding, for example.
Although this band on ABI is called the Cirrus Channel, it has other uses. It can be used to detect any highly reflective aerosol, such as volcanic ash or blowing dust, as long as the features are not obscured by water vapor. It can also view the surface if the atmosphere is sufficiently dry: Research suggests that a total precipitable water of about 12 mm is sufficient to attenuate the radiation.
View only this post Read Less
![GOES-15 Water Vapor (6.5 µm) images [click to play animation]](https://cimss.ssec.wisc.edu/satellite-blog/wp-content/uploads/sites/5/2017/02/WVAnimation_2345_27feb2017.gif)
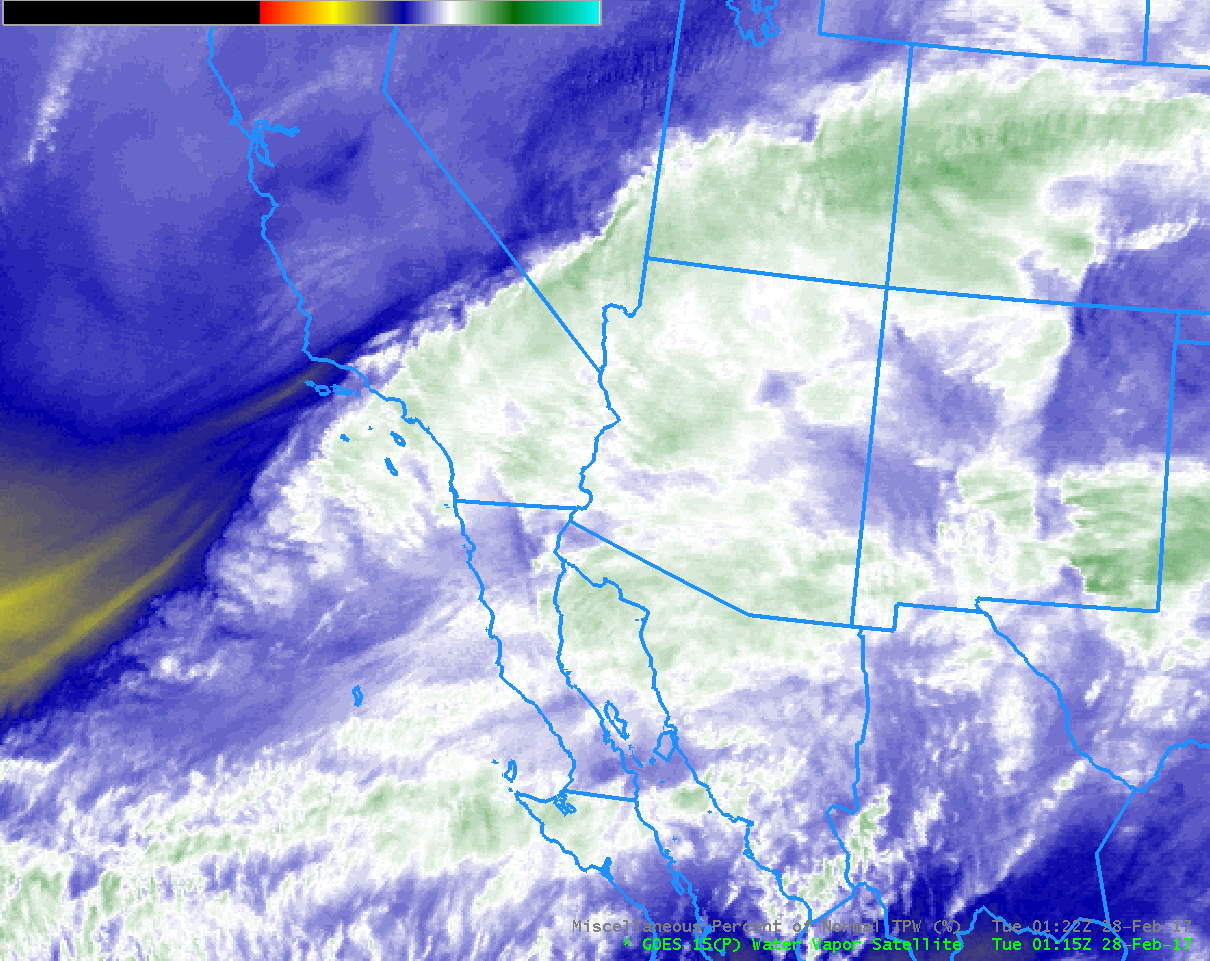
![Accumulated Precipitation for 24 hours ending 1200 UTC on 28 February 2017 [click to enlarge]](https://cimss.ssec.wisc.edu/satellite-blog/wp-content/uploads/sites/5/2017/02/waterweathergov.prcip_SoCalRains_27Feb2017.png)
![Hourly MIMIC Total Precipitable Water estimates for the 72 hours ending 1400 UTC on 28 February 2017 [click to enlarge]](https://cimss.ssec.wisc.edu/satellite-blog/wp-content/uploads/sites/5/2017/02/MIMIC_TPW_EPAC_latest72hrs_Ending1400_28feb2017.gif)
![NOAA/NESDIS Blended Total Precipitable Water Percent-of-Normal, times as indicated [click to play animation]](https://cimss.ssec.wisc.edu/satellite-blog/wp-content/uploads/sites/5/2017/02/TPW_PON_28Feb2017_stepanim.gif)
![Water Vapor Weighting Functions at 72293 (San Diego) for GOES Imager (6.5 µm) (Black Line) and GOES Sounder (7.4 µm) (Red Line) at 0000 UTC 27 February (Left) and 1200 UTC 28 February (Right). The Sounding for San Diego is also indicated [click to enlarge]](https://cimss.ssec.wisc.edu/satellite-blog/wp-content/uploads/sites/5/2017/02/GW72293_T0_00_12_BANDTD_Imager_SounderWV.toggle.gif)
![GOES-16 ABI Visible (0.64 µm) images [click to play animation]](https://cimss.ssec.wisc.edu/satellite-blog/wp-content/uploads/sites/5/2017/02/170226_goes16_visible_Southern_Hemisphere_eclipse_shadow_zoom_2_anim.gif)
![Path of 26 February 2017 solar eclipse shadow [click to enlarge]](http://en.es-static.us/upl/2017/02/SE2017Feb26A.png)
![GOES-16 true-color images [click to play animation]](https://cimss.ssec.wisc.edu/satellite-blog/wp-content/uploads/sites/5/2017/02/2017_SH_solar_eclipse_shadow_truecolor_anim.gif)
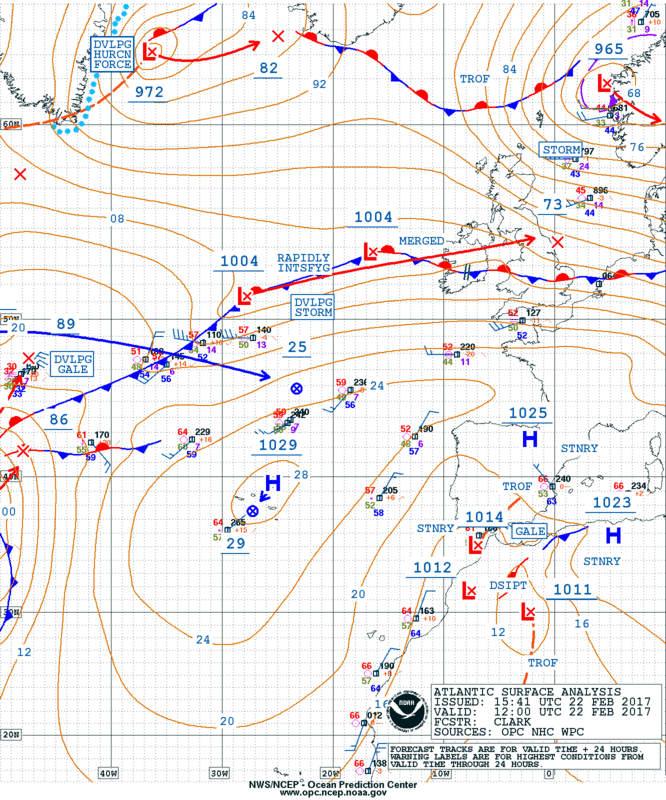
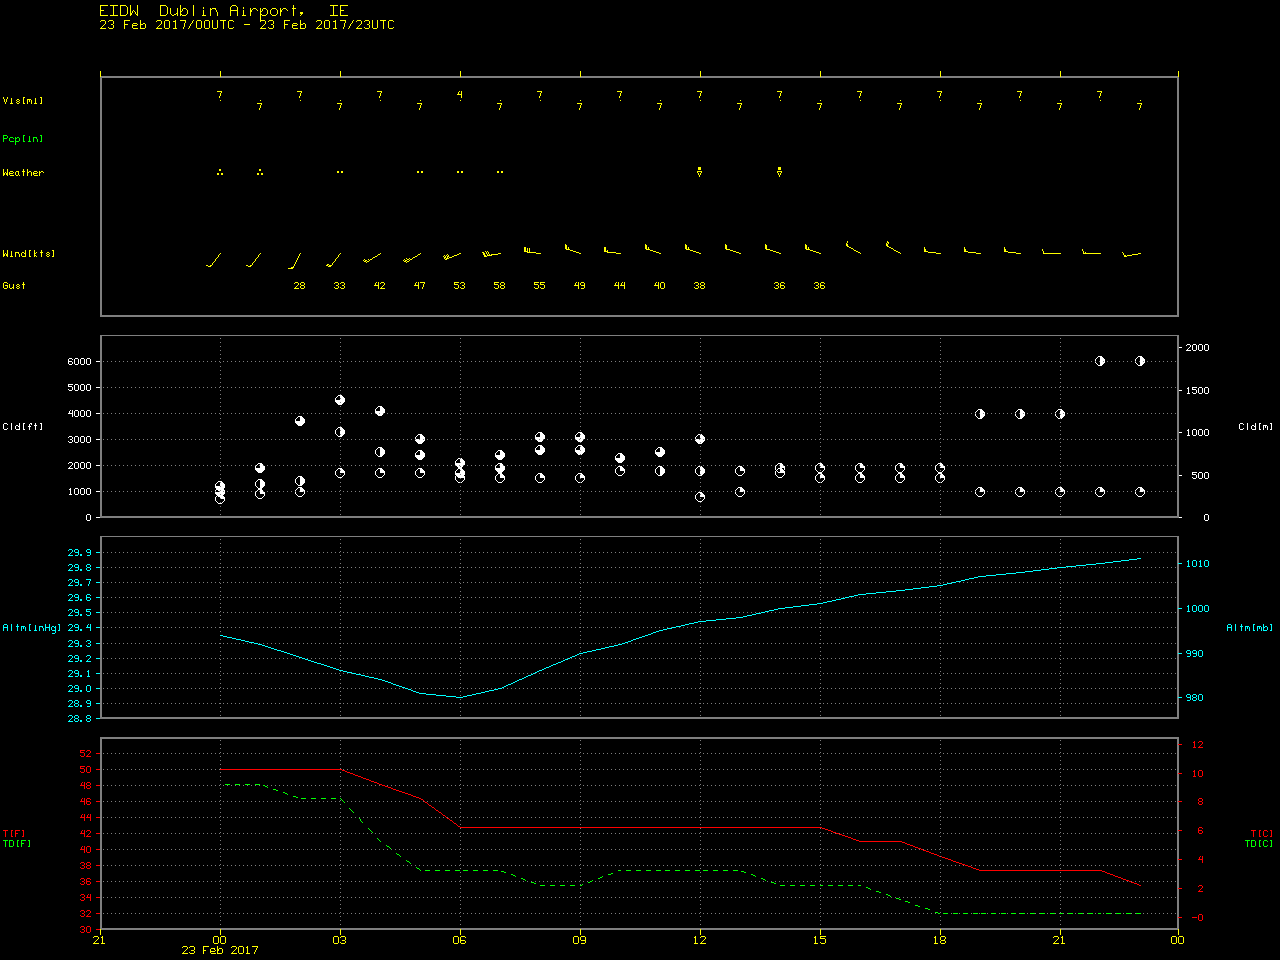
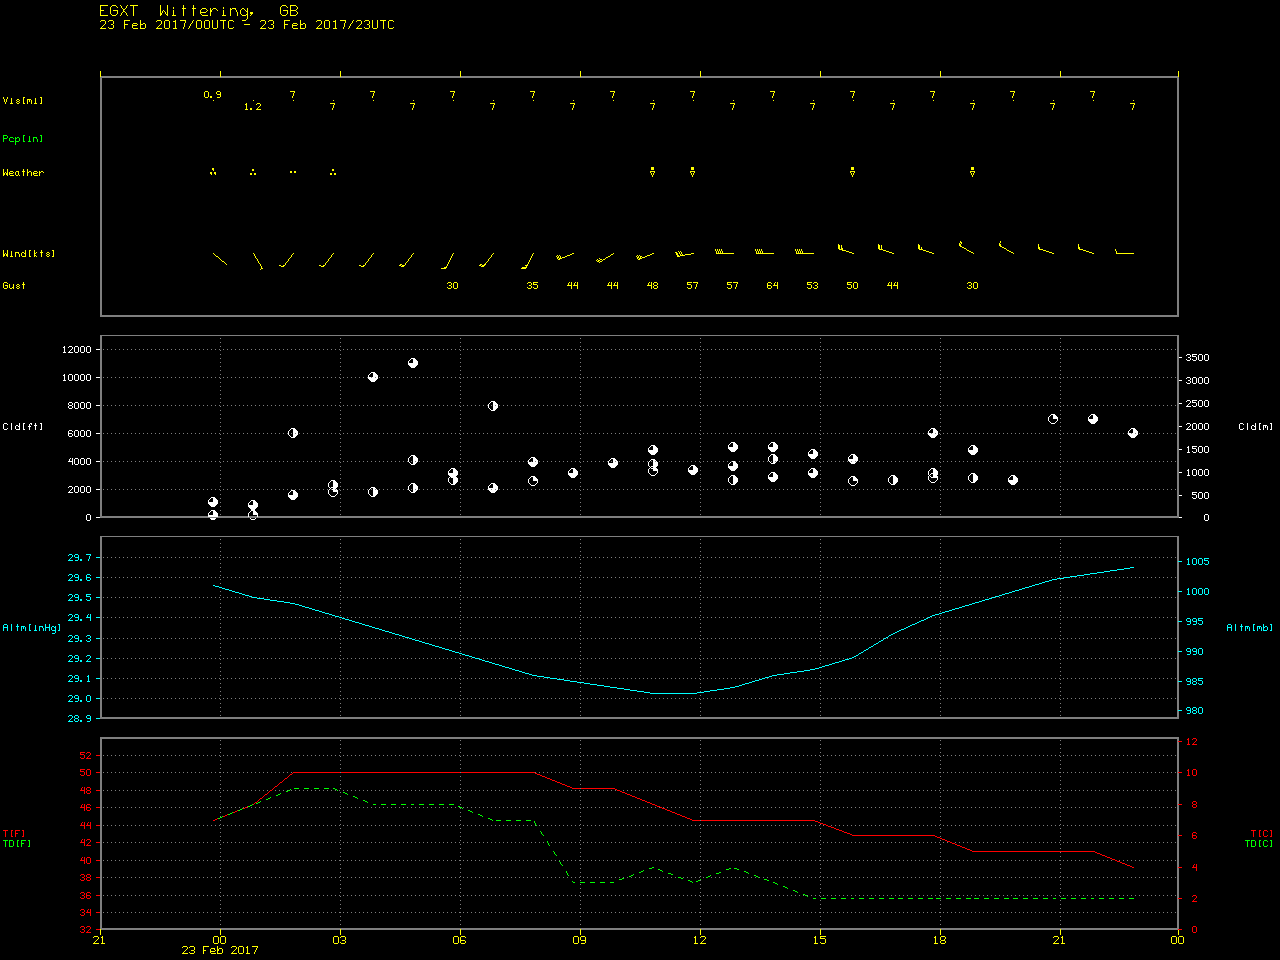
![Meteosat-10 Water Vapor (6.25 µm) images, with hourly surface wind gusts in knots [click to play animation]](https://cimss.ssec.wisc.edu/satellite-blog/wp-content/uploads/sites/5/2017/02/170223_meteosat10_water_vapor_Storm_Doris_anim.gif)
![Meteosat-10 High Resolution Visible (0.8 µm) images, with hourly surface wind gusts in knots [click to play animation]](https://cimss.ssec.wisc.edu/satellite-blog/wp-content/uploads/sites/5/2017/02/170223_meteosat10_visible_Storm_Doris_anim.gif)
![Terra MODIS (1039 UTC), Aqua MODIS (1226 UTC) and Suomi NPP VIIRS (1248 UTC) true-color RGB images [click to enlarge]](https://cimss.ssec.wisc.edu/satellite-blog/wp-content/uploads/sites/5/2017/02/170223_modis_viirs_truecolor_Storm_Doris_anim.gif)
