This website works best with a newer web browser such as Chrome, Firefox, Safari or Microsoft
Edge. Internet Explorer is not supported by this website.
The National Hurricane Center is monitoring an area of disturbed weather over the western Atlantic, to the north of the Bahamas and south of Cape Hatteras. The three-hour animation from the CSPP GeoSphere site (link, above), shows convection and a small low-level cyclonic circulation. This system is drifting to the... Read More
CSPP GeoSphere animation, 1240-1550 UTC on 25 July 2021
The National Hurricane Center is monitoring an area of disturbed weather over the western Atlantic, to the north of the Bahamas and south of Cape Hatteras. The three-hour animation from the CSPP GeoSphere site (link, above), shows convection and a small low-level cyclonic circulation. This system is drifting to the east, towards Florida, and is in an environment of small values of vertical wind shear (the analysis below is from the CIMSS Tropical Weather Site) that could augur further development. Refer to the pages of the National Hurricane Center for more information.
200-850 Shear Values, 1400 UTC on 25 July 2021. The disturbance center is denoted with an I.
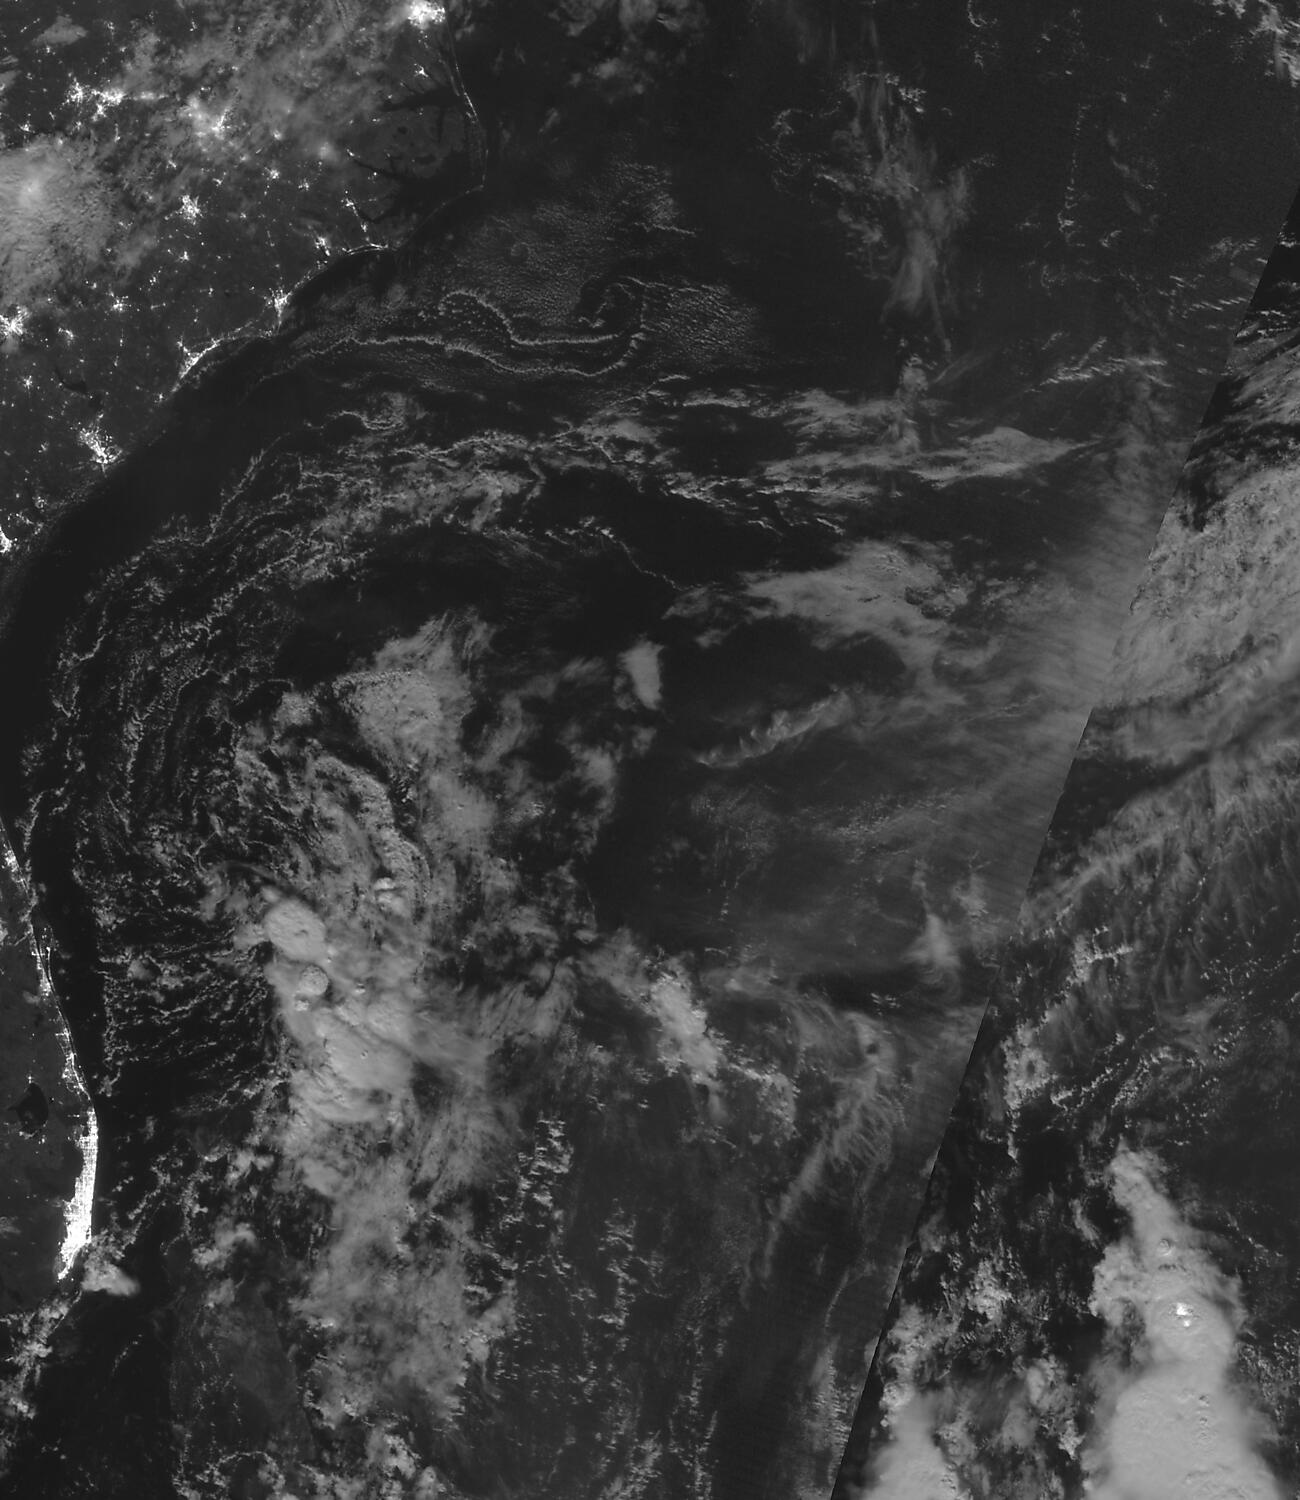
The Day Night Band image from Suomi NPP, below, from the early morning of 25 July 2021, (from the VIIRS Today website) shows the storm under the waning Buck Full Moon. Compare that to the NOAA-20 Day Night Band image from 24 July, the night before (link): the amount of convection decreased between 24 and 25 July.
Suomi NPP Day Night Band imagery, 25 July 2021
On the morning of 26 July 2021, the disturbance is moving into Florida/Georgia. Convection associated with the system is not over its center. (CSPP Geosphere link)
CSPP Geosphere animation, 1320-1610 UTC on 26 July 2021
Microwave estimates of total precipitable water over the western Pacific Ocean (available here) show a moist airmass — out of which Typhoon In-Fa (seen near Taiwan in the animation) emerged — over the western Pacific Ocean. (The circulation of Tropical cyclone Cempaka is also apparent near the Gulf of Tonkin)... Read More
MIMIC Total Precipitable Water, 0000 UTC 21 July – 1200 UTC 22 July
Microwave estimates of total precipitable water over the western Pacific Ocean (available here) show a moist airmass — out of which Typhoon In-Fa (seen near Taiwan in the animation) emerged — over the western Pacific Ocean. (The circulation of Tropical cyclone Cempaka is also apparent near the Gulf of Tonkin) This rich moisture has led to very heavy rains and Flash Flood alerts on the island of Guam (at 13.4ºN, 144.5ºE). Are there any indications that a new tropical cyclone will emerge out of the moisture?
The toggle below shows Himawari-8 10.41 µm “Clean Window” infrared imagery (notice In-Fa in the northwest part of the image). A distinct trough is apparent in the scatterometery north of the Marianas islands (and north of 20ºN latitude), with west-southwesterly surface winds bordered by east-southeasterlies to the north. Weaker winds are indicated south of Guam. (For a recent primer on Scatterometer winds, click here; ASCAT winds can be found online here)
ASCAT Scatterometry winds and Himawari-8 Band 13 infrared (10.41 µm)imagery, 1200 UTC on 22 July 2021
NOAA-20 overflew this region at 1600 UTC on 22 July. The imagery below shows Tropopause Heights as well as Total Precipitable water — along with Band 13 imagery (over a different location) at that time. NUCAPS estimates of TPW are in the 60-70 mm range (in agreement with the MIMIC animation above); Very high tropopauses are Equatorward of 20 N Latitude.
A ribbon of small wind shear exists, as shown in the 200-850 wind shear analysis below, taken from the CIMSS Tropical Website. Meteorologists continue to monitor this region of tropical activity.
200-850 mb wind shear, 1800 UTC on 22 July 2021, over the western Pacific Ocean.
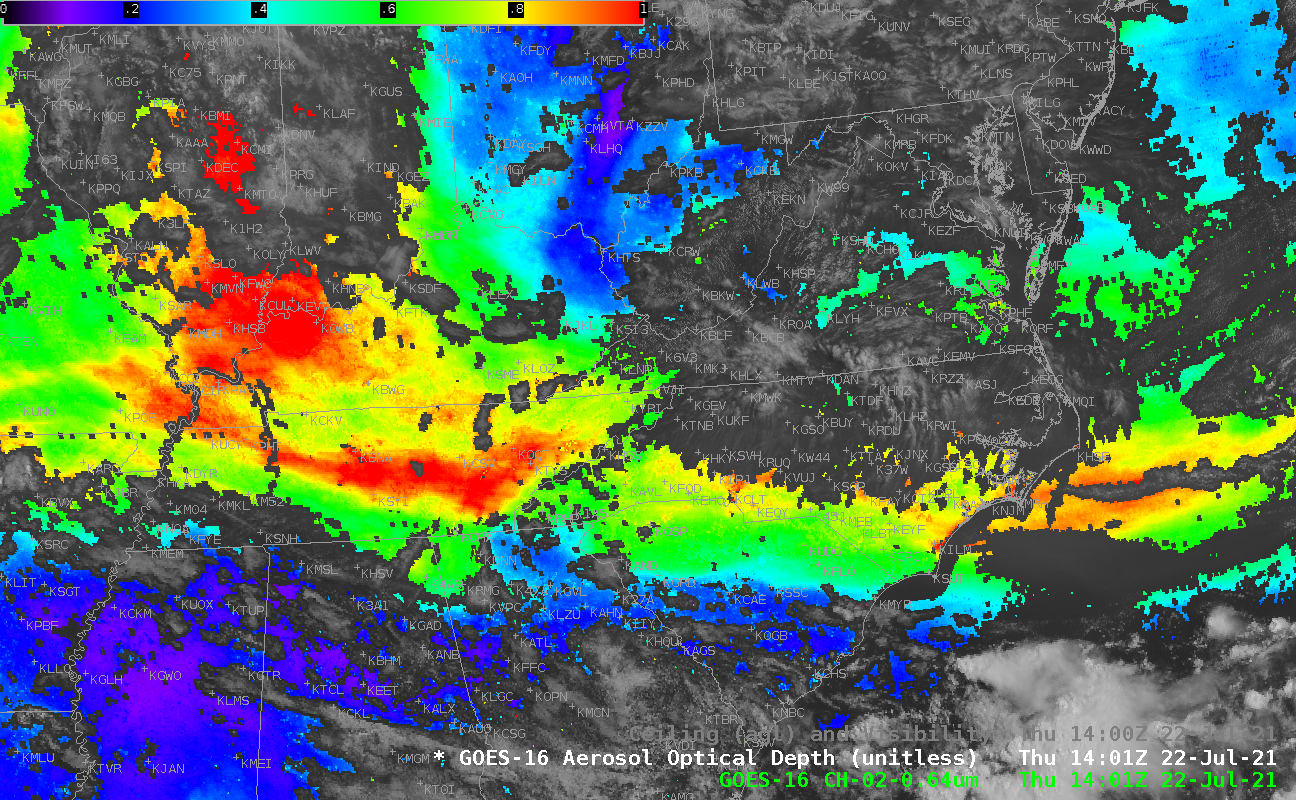
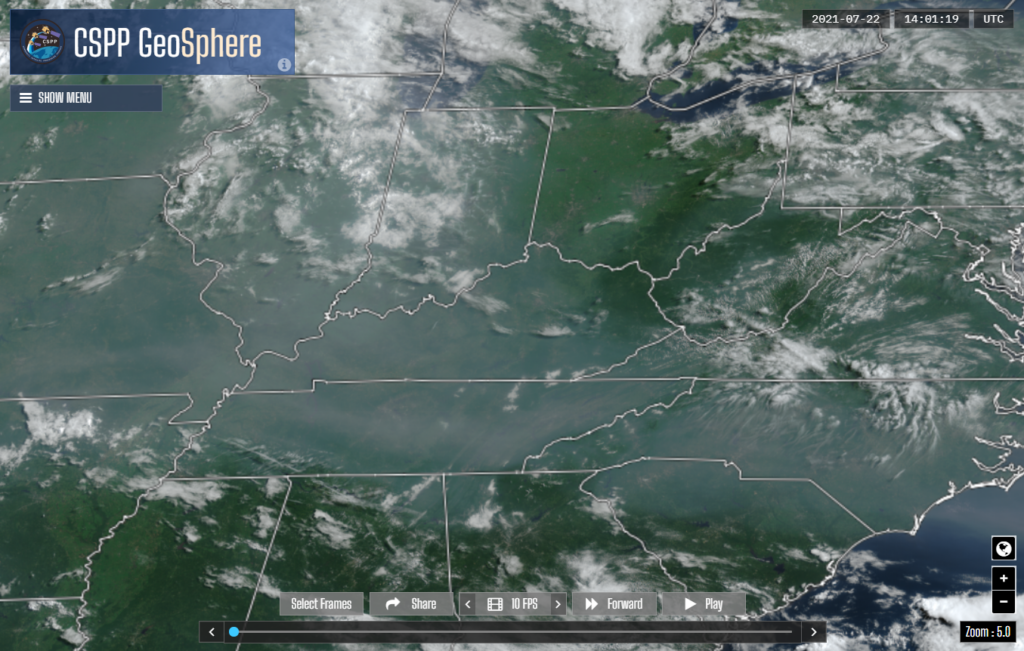
The image above shows the Level 2 GOES-R product, Aerosol Optical Depth (AOD), a product created in clear skies, overlain with the GOES-16 Visible imagery from the same time. AOD measures the extinction of light via scattering and absorption by small particles in the atmosphere, and it can be used... Read More
GOES-16 Aerosol Optical Depth and GOES-16 Band 2 Visible (0.64 µm) imagery, 1401 UTC on 22 July 2021
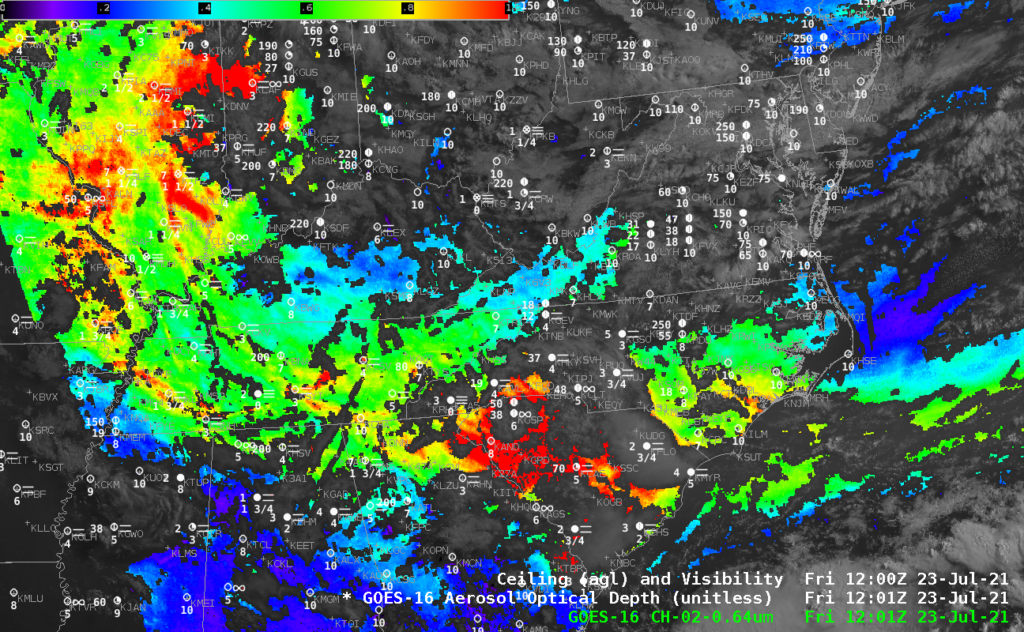
The image above shows the Level 2 GOES-R product, Aerosol Optical Depth (AOD), a product created in clear skies, overlain with the GOES-16 Visible imagery from the same time. AOD measures the extinction of light via scattering and absorption by small particles in the atmosphere, and it can be used as a proxy for particles smaller than 2.5 µm in diameter (PM25). The red regions show the highest values. The plot below shows surface observations of ceilings (plotted to the left of the circles) and visibility (plotted below the circles) at the same time as the AOD image above. Is there a relationship?
Look at the string of lower visibilities stretching along the North Carolina/South Carolina border, extending westward to Tennessee and then northward into Illinois. This is the region where AOD exceeds about 0.4 — cyan in the enhancement used above. In this instance, AOD can be used to highlight regions where surface visibilities are most restricted by aerosols. (Some of these aerosols are likely from smoke. However, this product does not tell you what kind of aerosol is there, only that it is causing extinction).
Surface observations of ceilings and visibilities, 1401 UTC on 22 July 2021
The toggle below steps through the observations, AOD, and Visible imagery at 1401 UTC. Kudos to Frank Alsheimer, the Science and Operations Office (SOO) in Columbia SC, for alerting us to this case.
Surface observations of ceilings and visibilities, GOES-16 Aerosol Optical Depth and GOES-16 Band 2 Visible (0.64 µm) imagery, 1401 UTC on 22 July 2021
True-color imagery, below, (saved in this case from the CSPP Geosphere site, using this link) also shows the extent of the aerosol-rich air.
GOES-16 ‘True-Color’ imagery at 1401 UTC on 22 July 2021
The relationship between AOD values and surface visibility persisted on 23 July 2021, below.
GOES-16 Aerosol Optical Depth and GOES-16 Band 2 Visible (0.64 µm) imagery, 1201 UTC on 23 July 2021
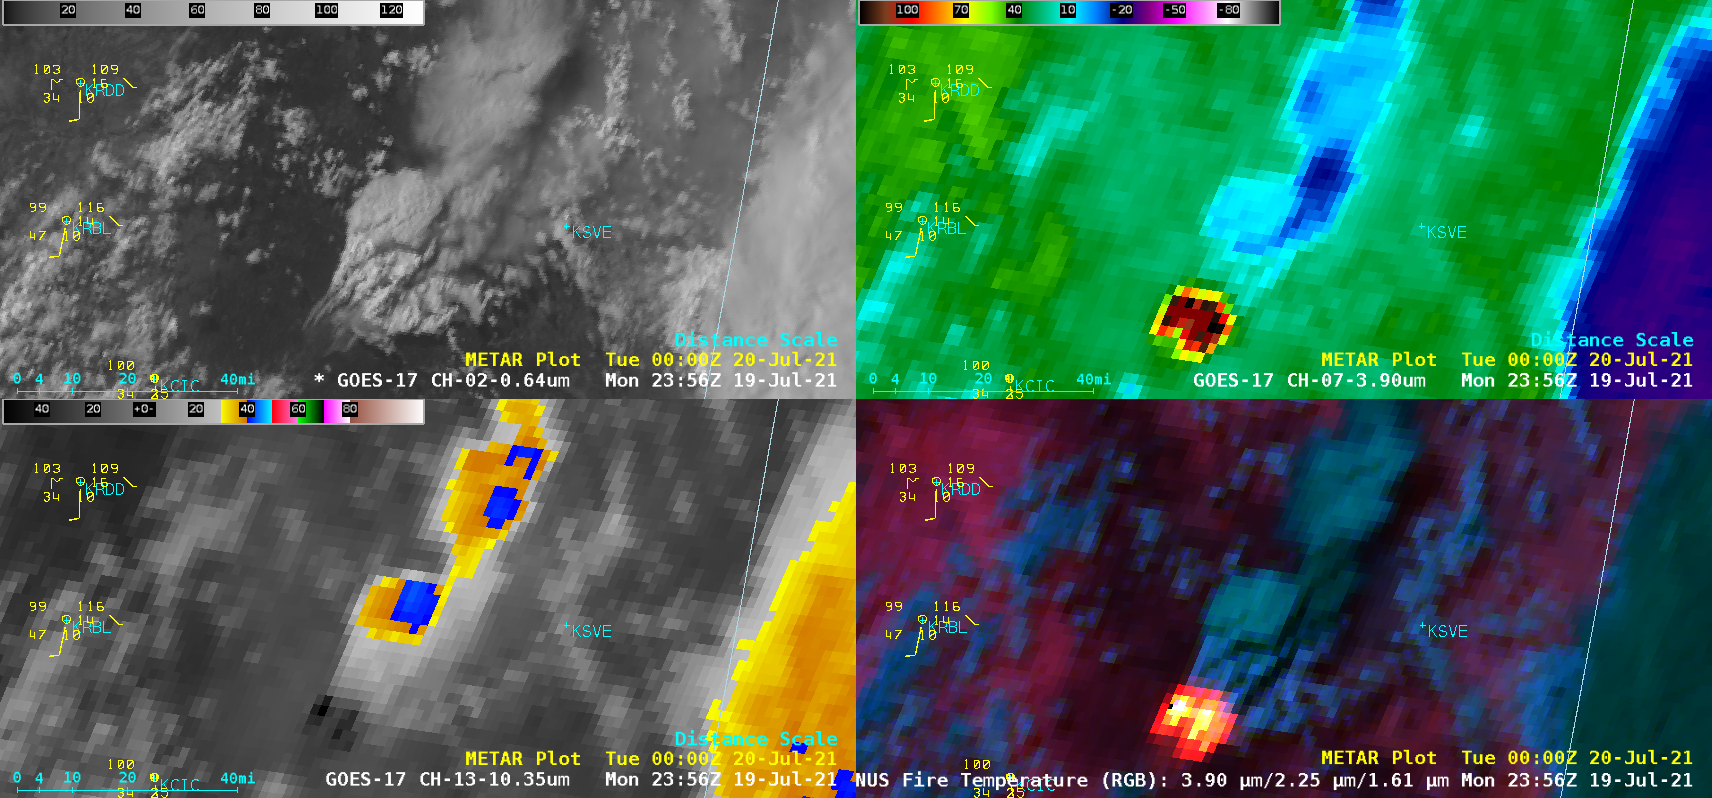
5-minute GOES-17 (GOES-West) “Red” Visible (0.64 µm), Shortwave Infrared (3.9 µm), “Clean” Infrared Window (10.35 µm) and Fire Temperature RGB images (above) revealed that the Dixie Fire in northern California produced a pair of pyrocumulonimbus (pyroCb) clouds — denoted by cloud-top 10.35 µm infrared brightness temperatures of -40ºC or colder (shades of blue pixels) — late in the day on 19 July 2021.... Read More
GOES-17 “Red” Visible (0.64µm, top left), Shortwave Infrared (3.9µm, top right), “Clean” Infrared Window (10.35µm, bottom left), and Fire Temperature RGB (bottom right) [click to play animation | MP4]
5-minute GOES-17 (GOES-West) “Red” Visible (0.64 µm), Shortwave Infrared (3.9 µm), “Clean” Infrared Window (10.35 µm) and Fire Temperature RGB images (above) revealed that the Dixie Fire in northern California produced a pair of pyrocumulonimbus (pyroCb) clouds — denoted by cloud-top 10.35 µm infrared brightness temperatures of -40ºC or colder (shades of blue pixels) — late in the day on 19 July 2021. The first pyroCb formed at 2241 UTC, with the second at 2331 UTC, Maximum surface 3.9 µm brightness temperature sensed with this fire was 138.7ºC — which is the saturation temperature for the ABI Band 7 detectors.
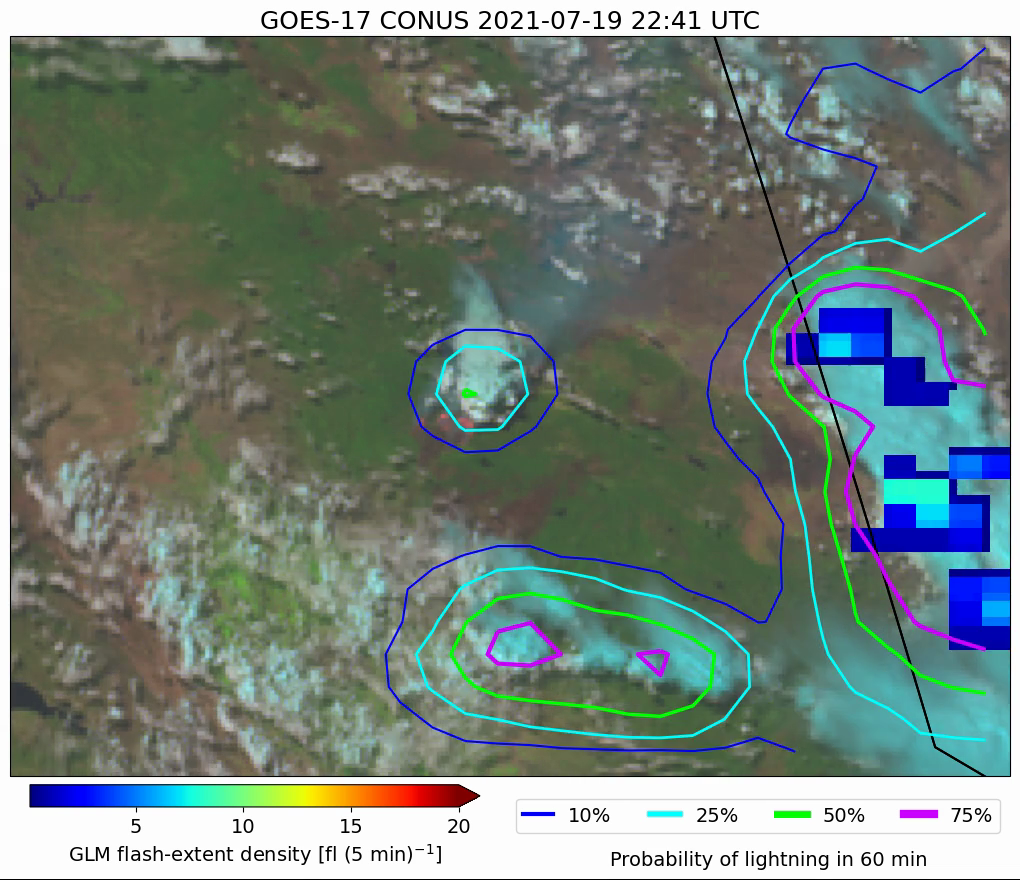
GOES-17 Day Land Cloud Fire RGB images (below) include plots of GLM Flash Extent Density and contours of ProbSevere LightnngCast probability — and show that LightningCast probability exceeded 50% as early as 2241 UTC (the time of the initial pyroCb formation), with the first GLM lightning being detected 40 minutes later at 2321 UTC. LightCast probability first exceeded 75% at 2341 UTC — with GLM Flash Extent Density increasing in coverage and intensity 30 minutes later after 0011 UTC (associated with the second pyroCb anvil as it drifted north-northeastward).
GOES’-17 Day Land Cloud Fire RGB images, with GLM Flash Extent Density and contours of ProbSevere LightningCast probability (credit: John Cintineo, CIMSS) [click to play MP4 animation]
This case demonstrates that LightningCast can clearly help improve wildland fire incident awareness and assessment (and safety).


![GOES-17 “Red” Visible (0.64 µm, top left), Shortwave Infrared (3.9 µm, top right), “Clean” Infrared Window (10.35 µm, bottom left) and Fire Temperature RGB (bottom right) [click to play animation | MP4]](https://cimss.ssec.wisc.edu/satellite-blog/images/2021/07/210719_goes17_visible_shortwaveInfrared_infraredWindow_fireTemperatureRGB_Dixie_Fire_CA_anim.gif)

