
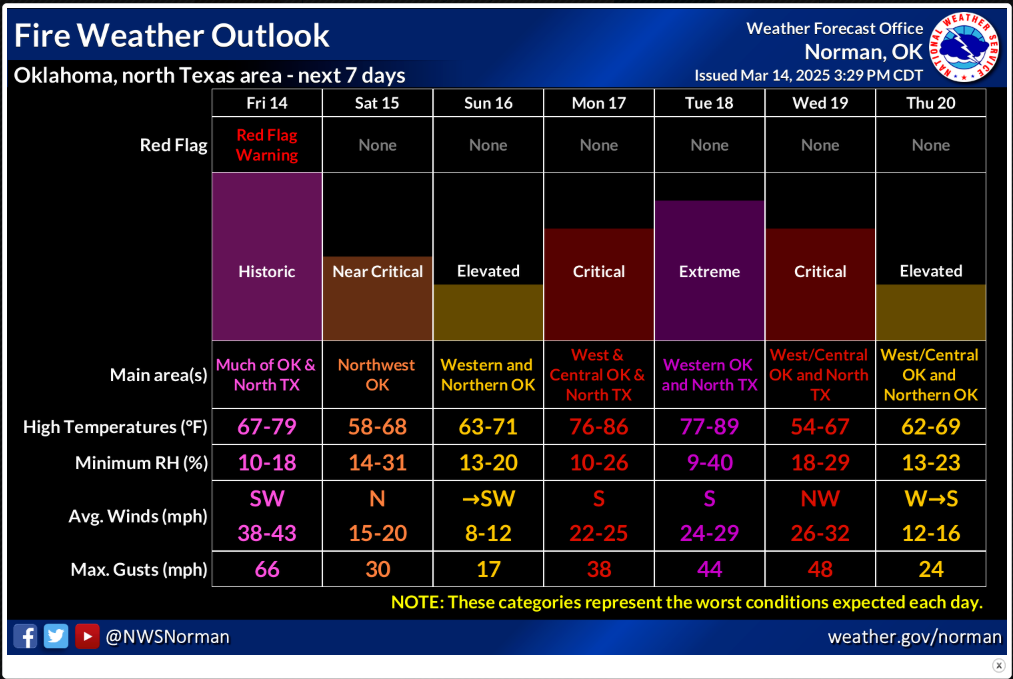
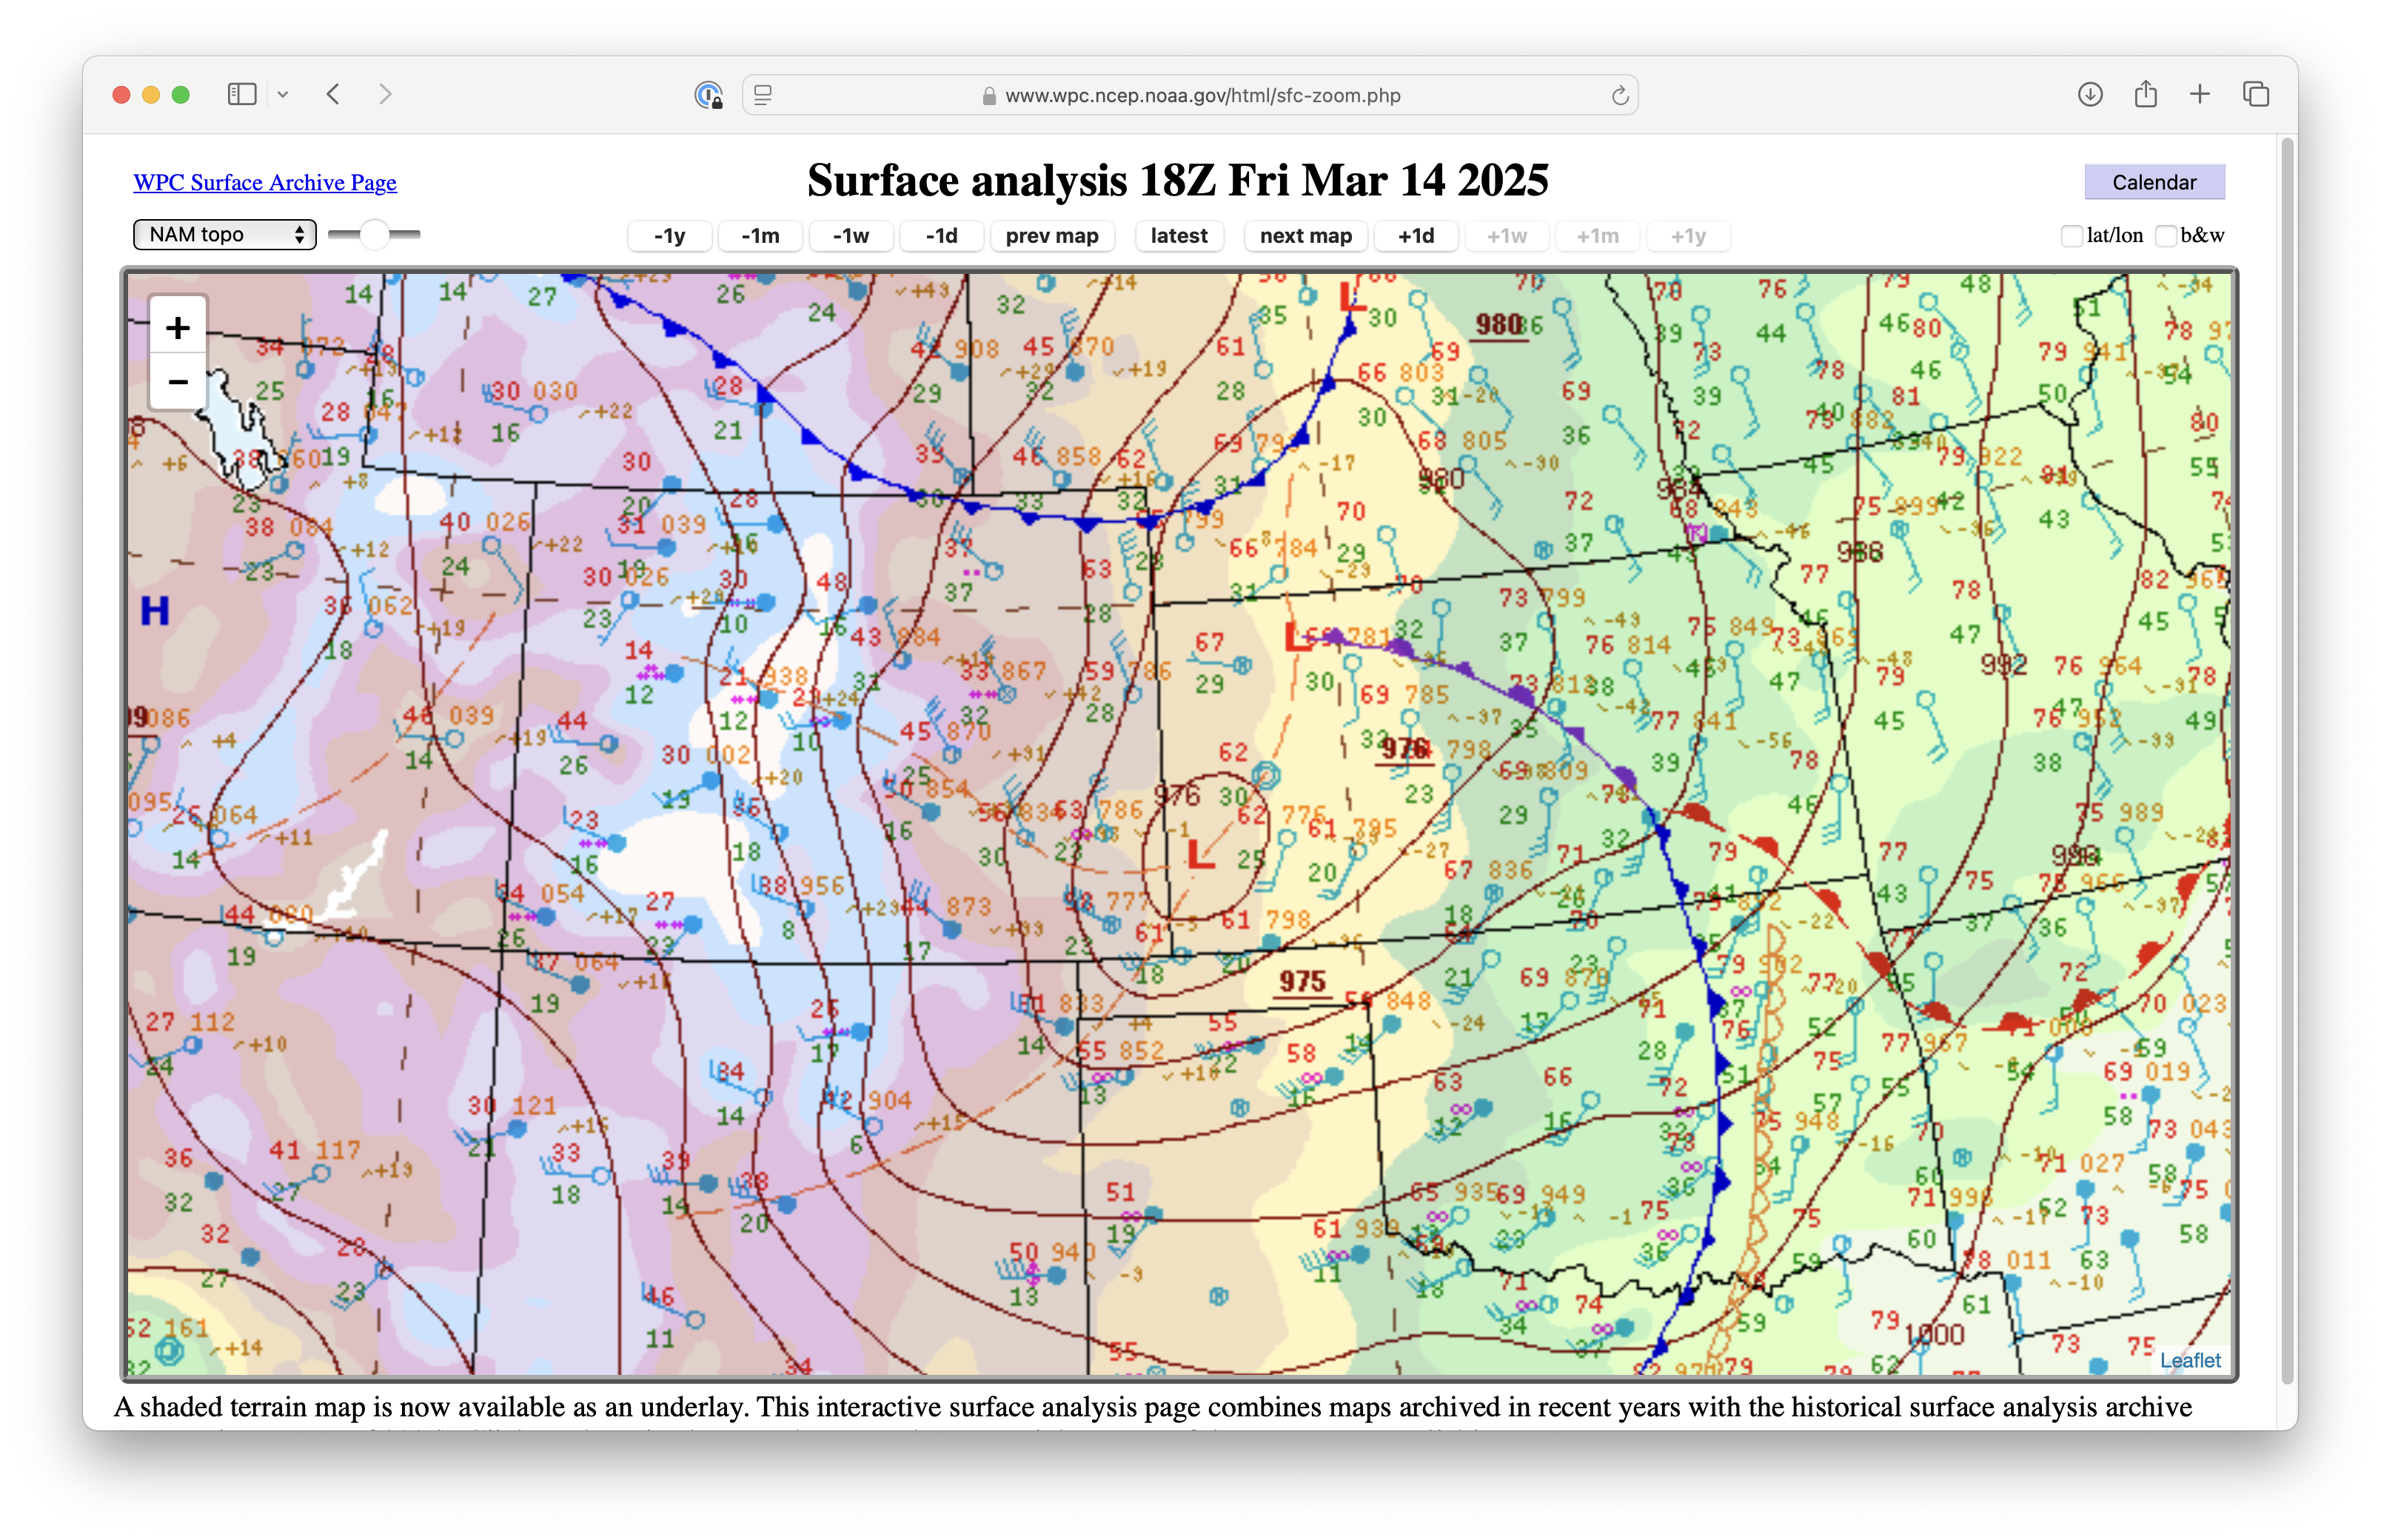
Aided by strong southwesterly winds gusting as high as 72 knots (83 mph) behind a cold front, more than 130 wildfires rapidly developed and spread across 44 counties in Oklahoma on 14 March 2025. 1-minute Mesoscale Domain Sector GOES-16 (GOES-East) Visible images (above) included overlays of 1-minute GOES-16 Fire Mask derived product (a component... Read More
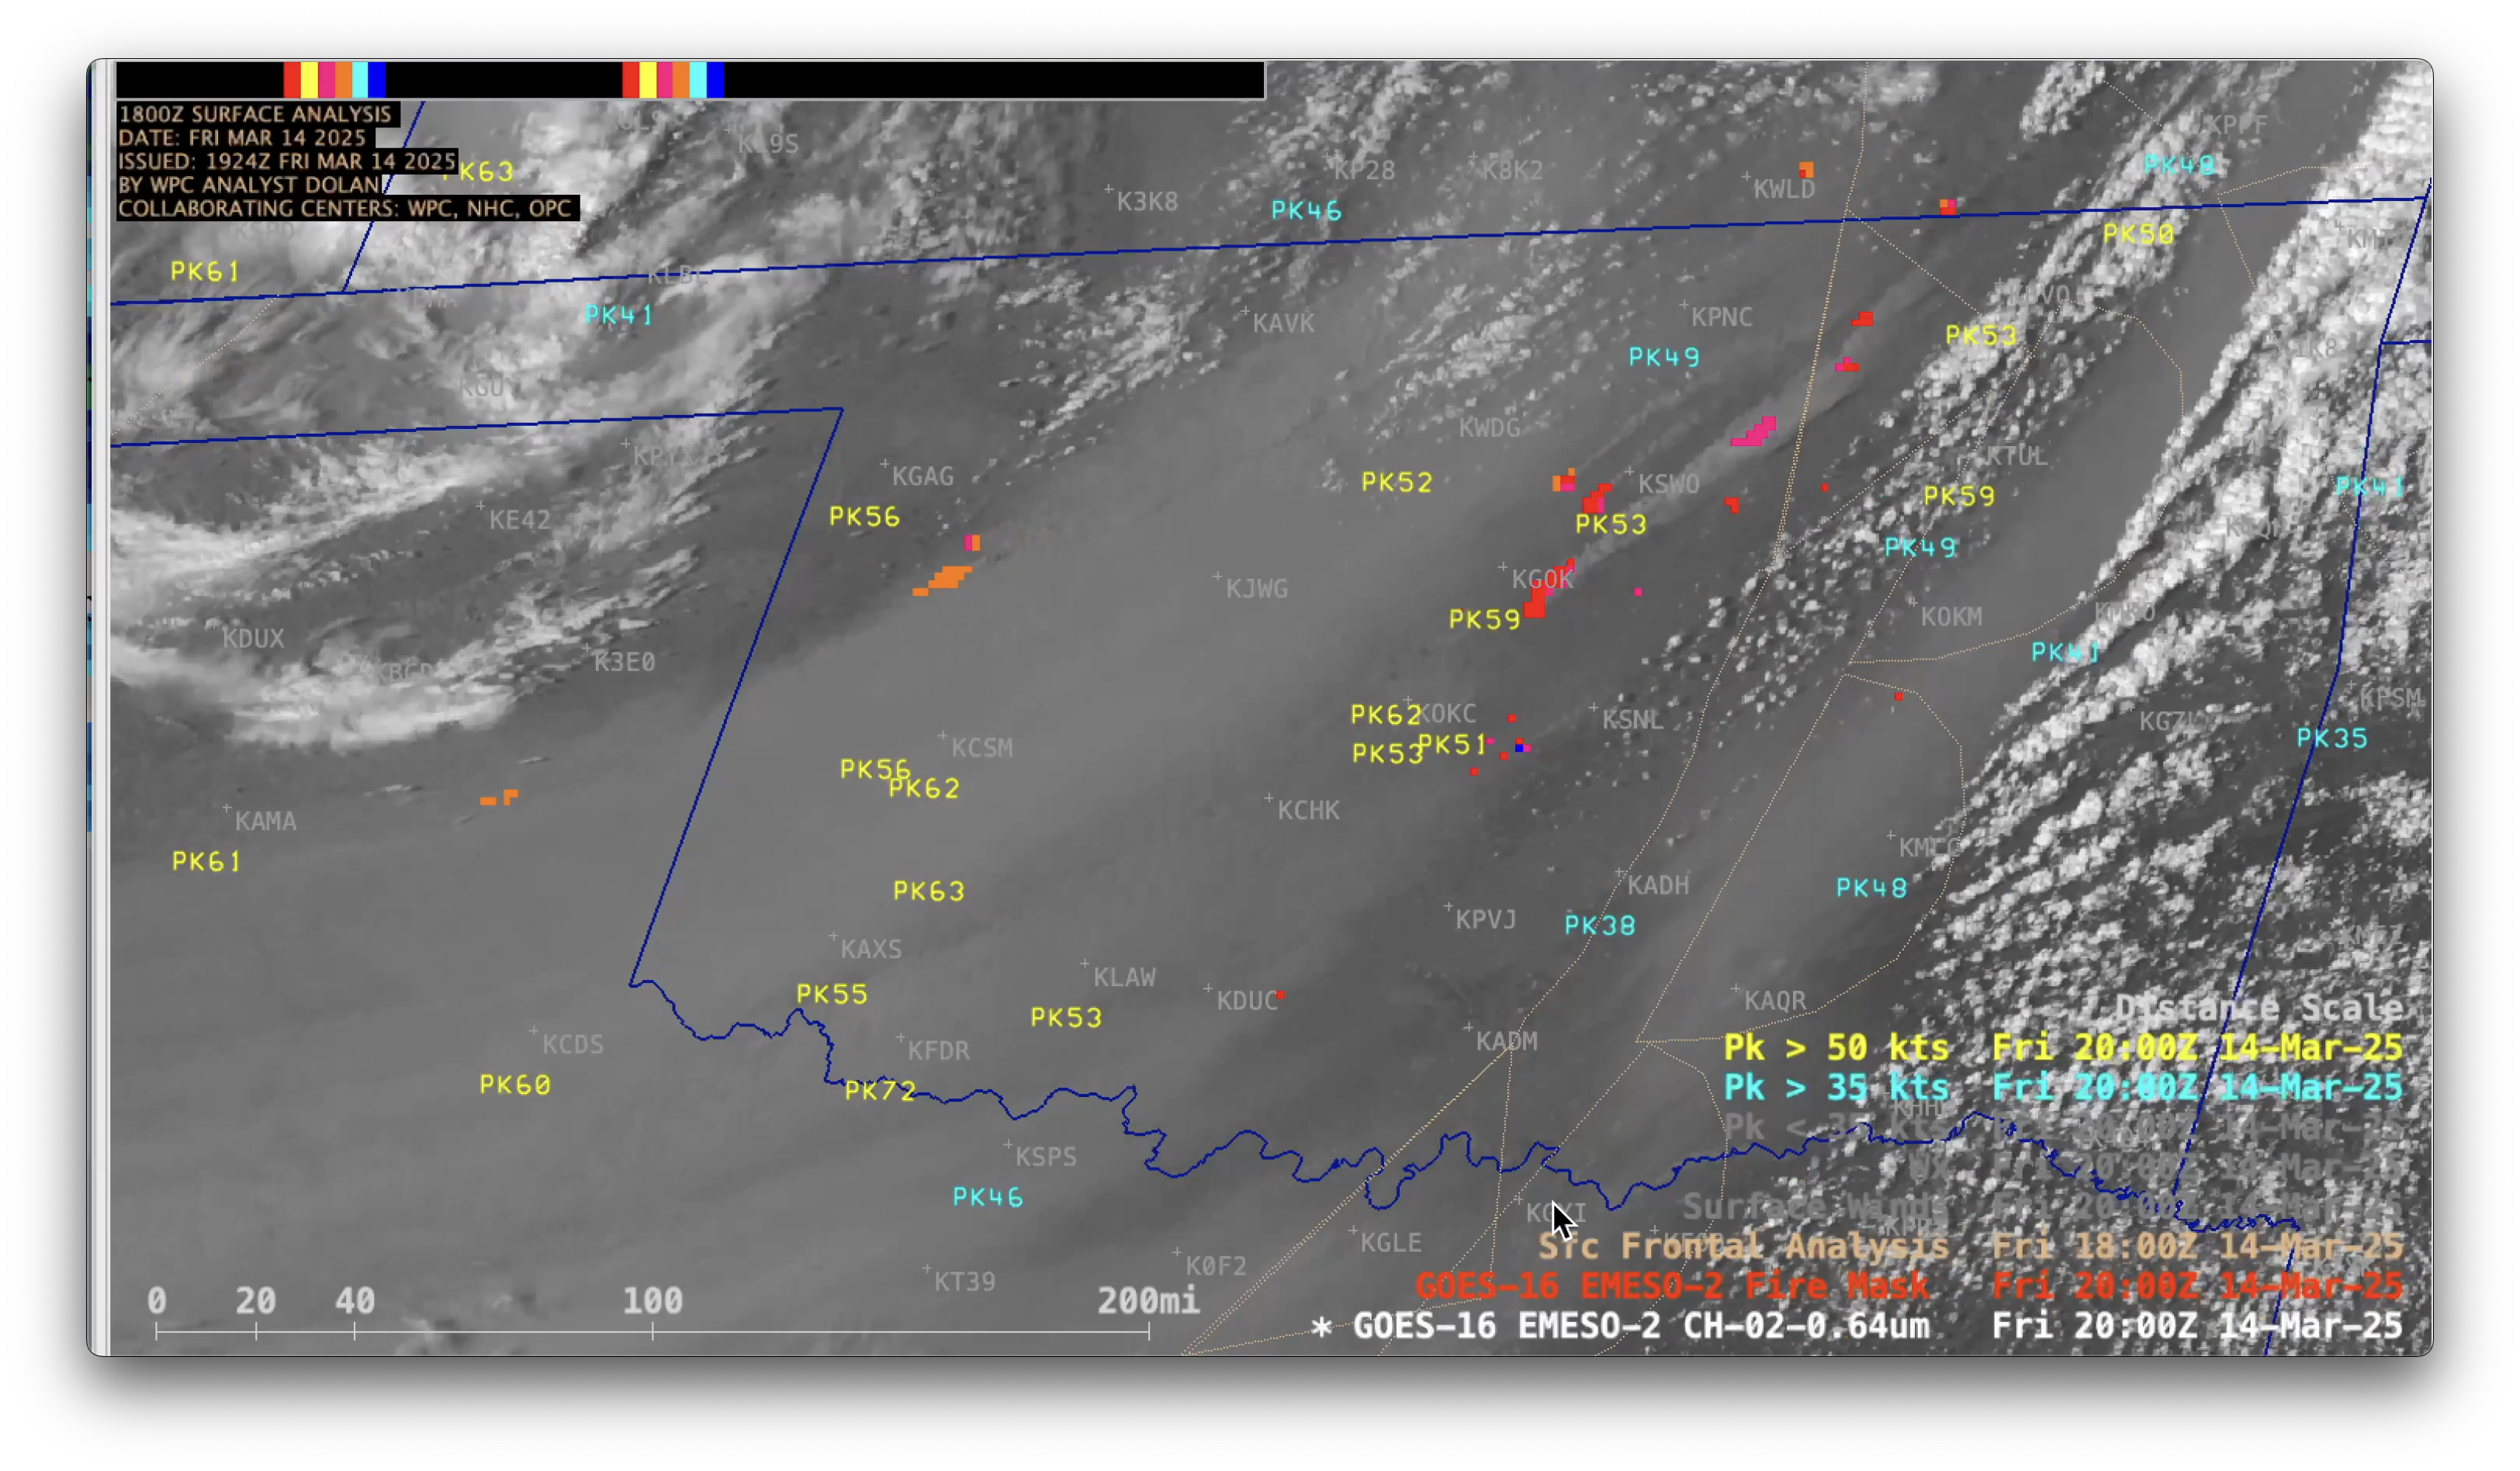
1-minute GOES-16 Visible images with overlays of 1-minute GOES-16 Fire Mask derived product and 30-minute Peak Wind Gusts, from 1501 UTC on 14 March to 0000 UTC on 15 March [click to play MP4 animation]
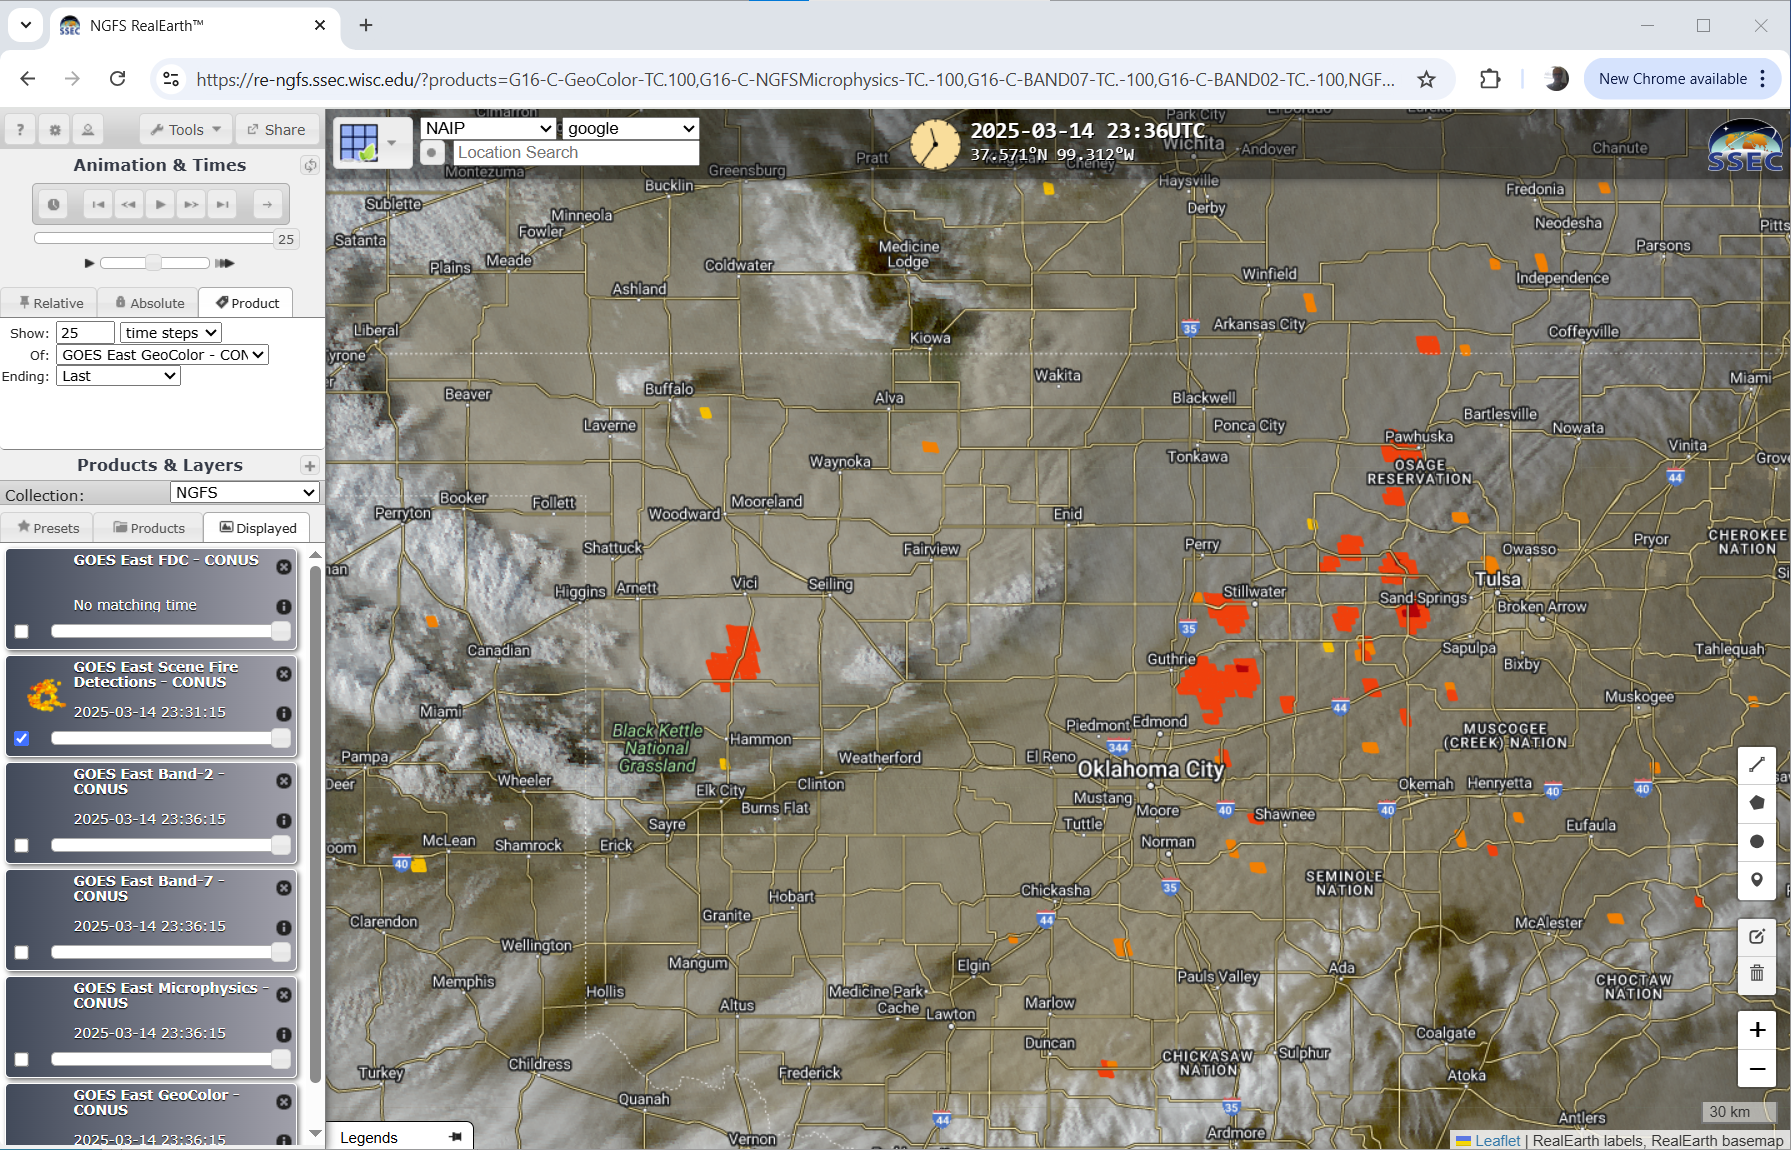
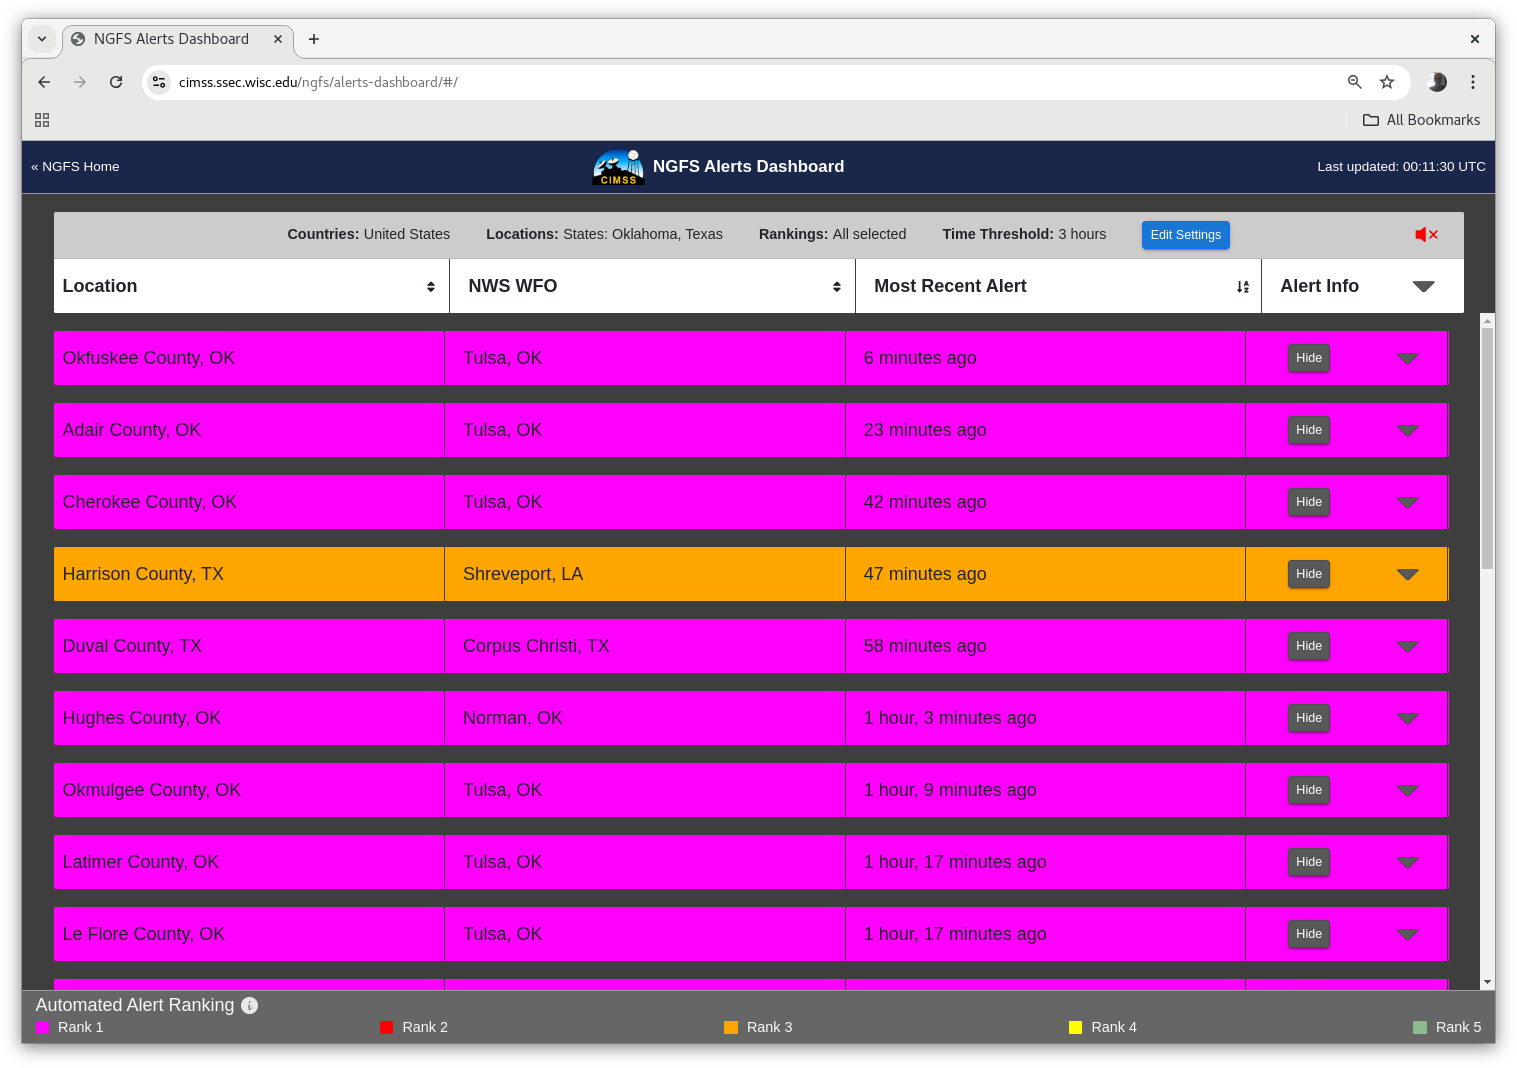
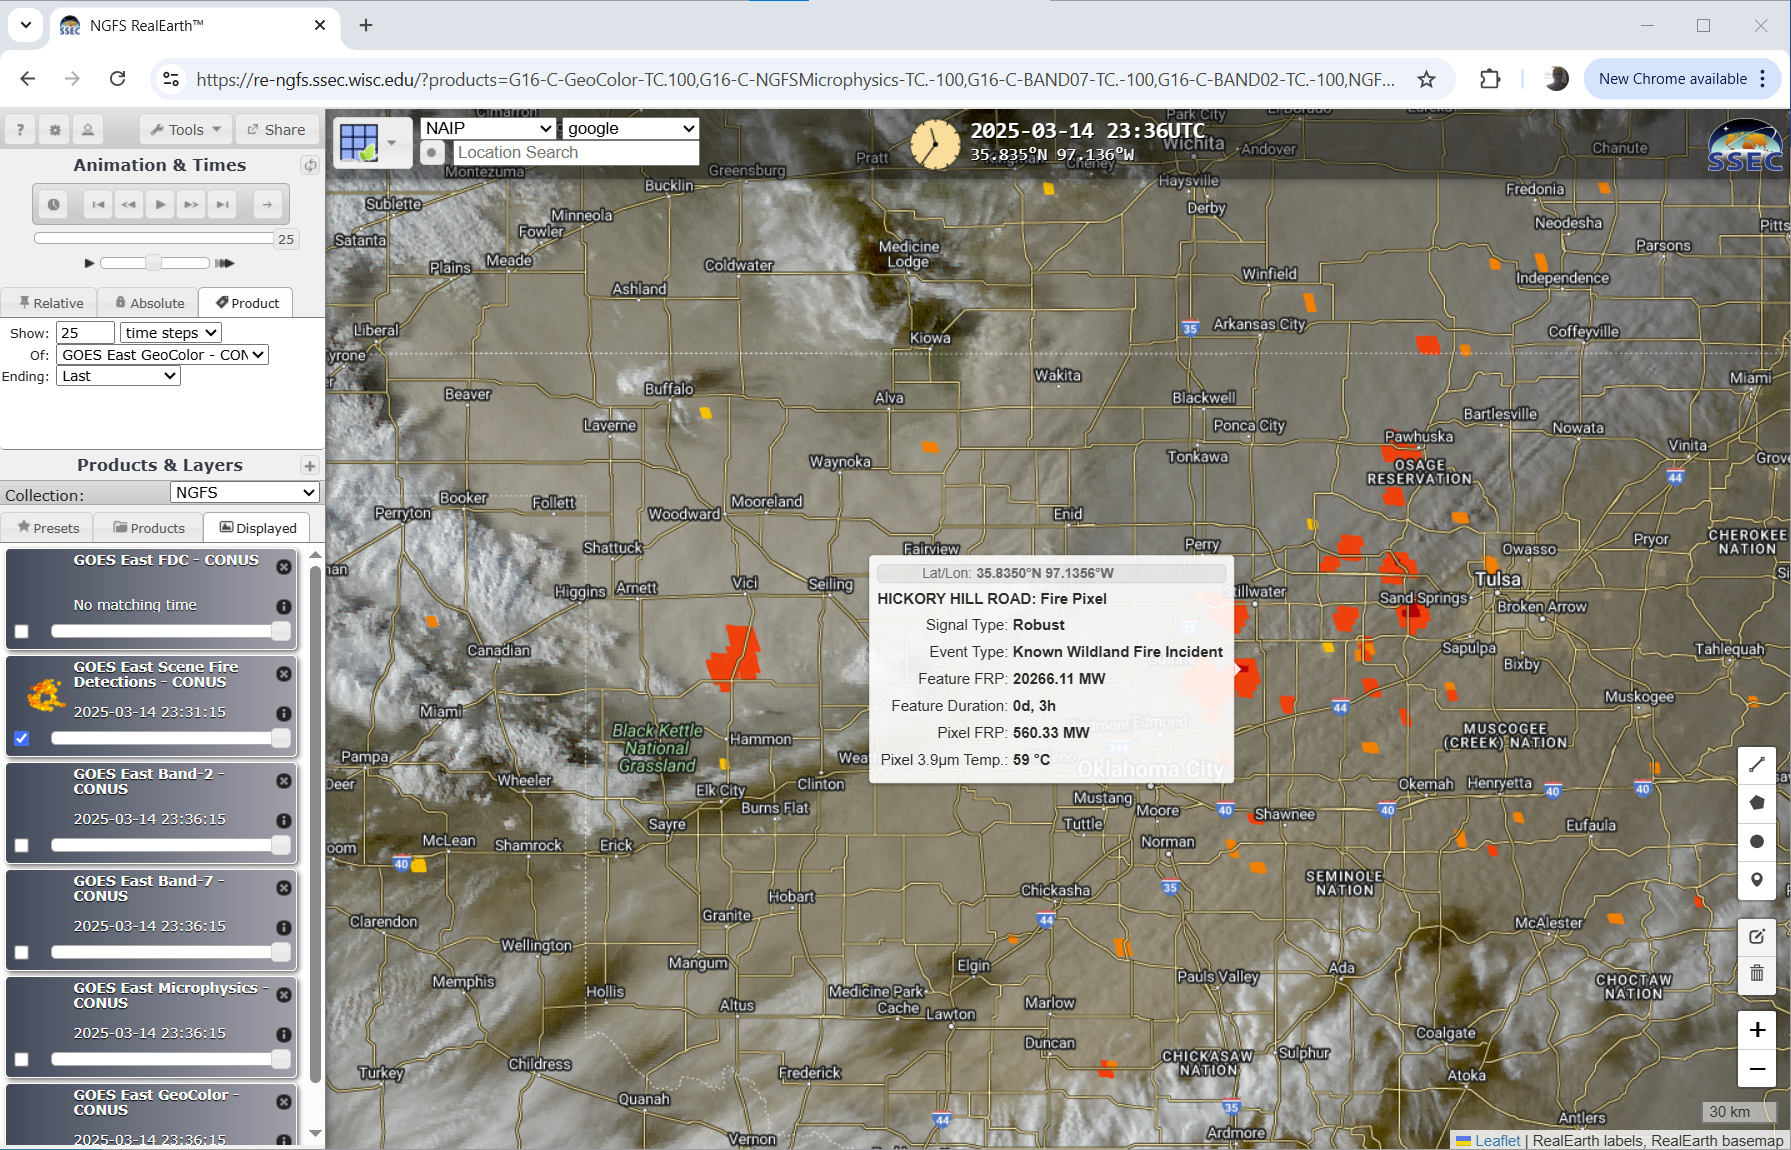
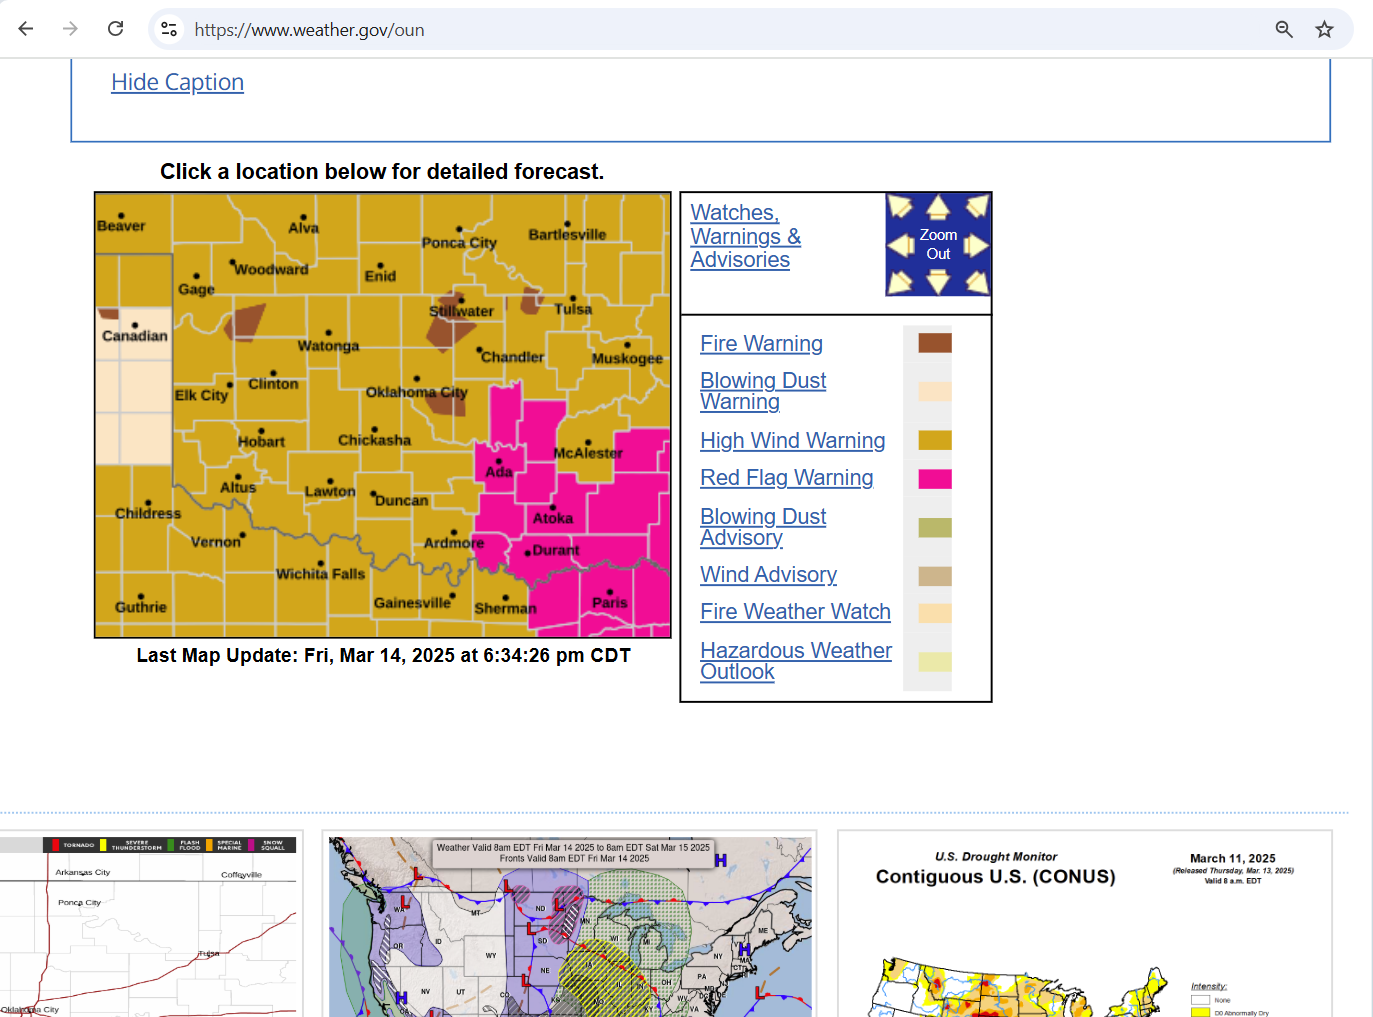
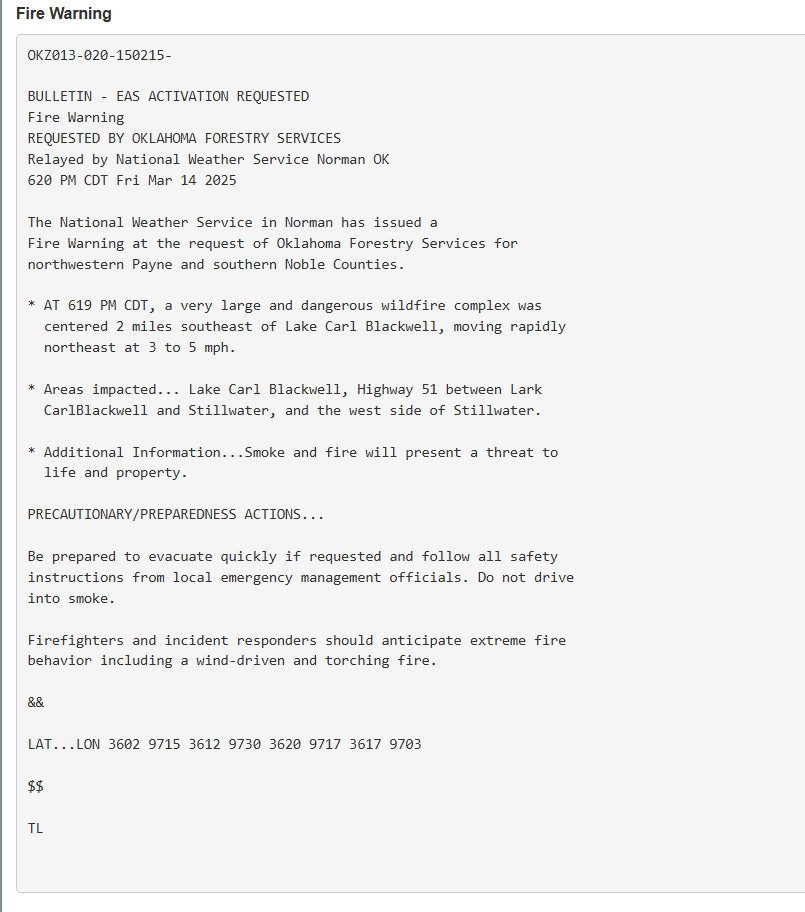
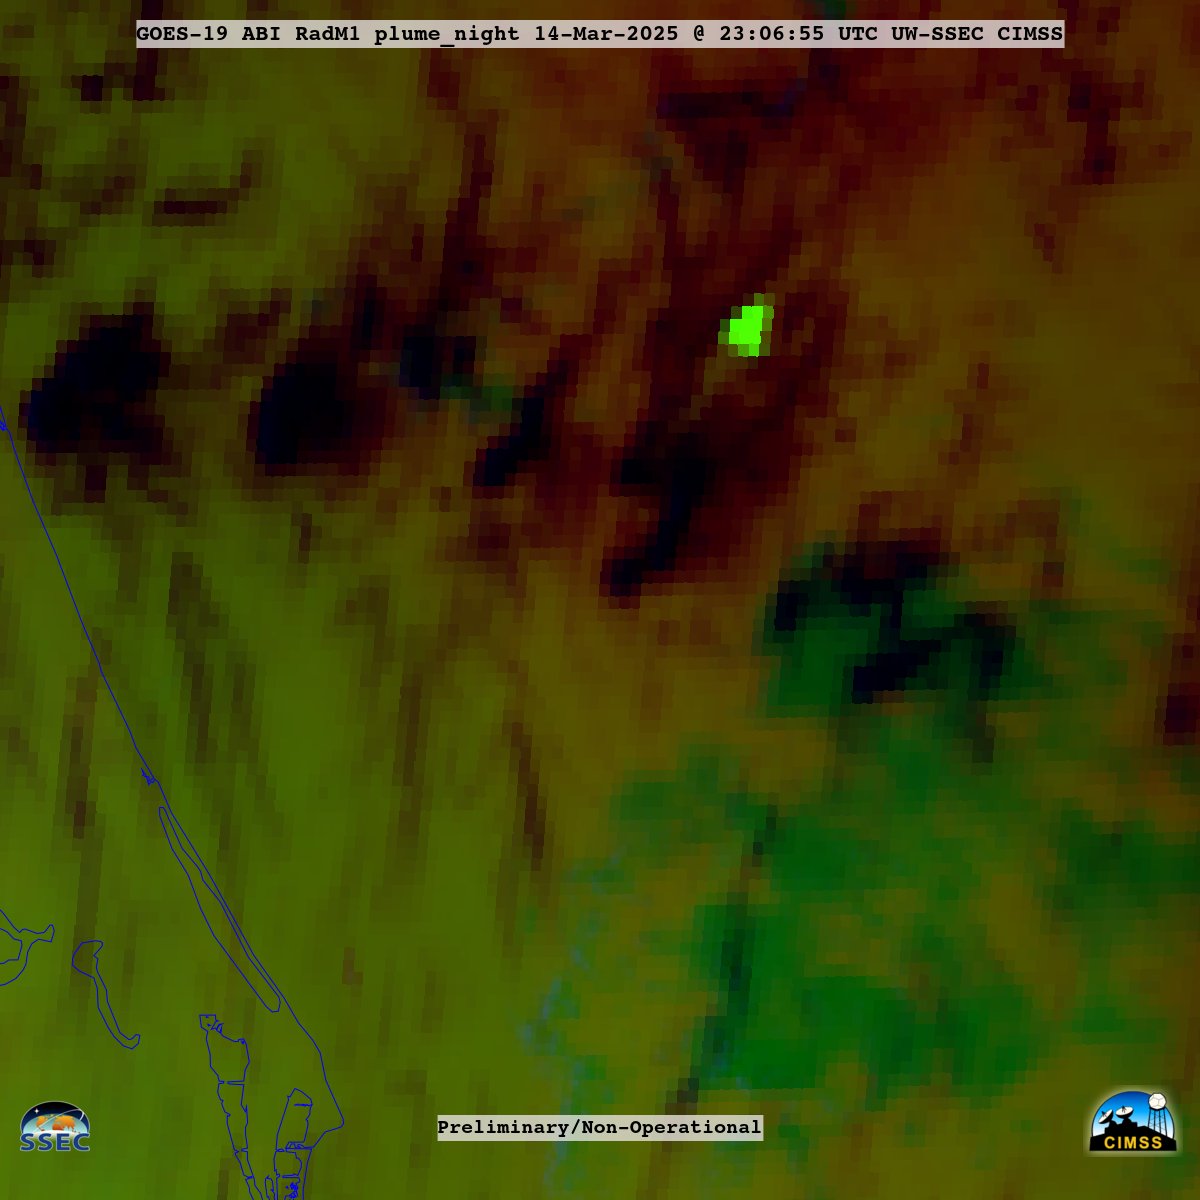
Aided by strong southwesterly winds gusting as high as 72 knots (83 mph) behind a cold front, more than 130 wildfires rapidly developed and spread across 44 counties in Oklahoma on 14 March 2025. 1-minute Mesoscale Domain Sector GOES-16 (GOES-East) Visible images (above) included overlays of 1-minute GOES-16 Fire Mask derived product (a component of the Fire Detection and Characterization Algorithm, FDCA) and 30-minute Peak Wind Gusts — which showed a marked increase in wildfire thermal signatures after about 1900 UTC. Notable wildfires affected the Oklahoma City (KOKC) area (and nearby Norman), in addition to Guthrie (KGOK) and Stillwater (KSWO) — prompting the issuance of Fire Warnings and evacuation notices for those (and many other) locations. NGFS detections for some of these fires are shown in this blog post.
Incidentally, the wildfire just southwest of Stillwater (KSWO) burned through an Oklahoma Mesonet site from 2041-2045 UTC (2043 UTC GOES-16 image):
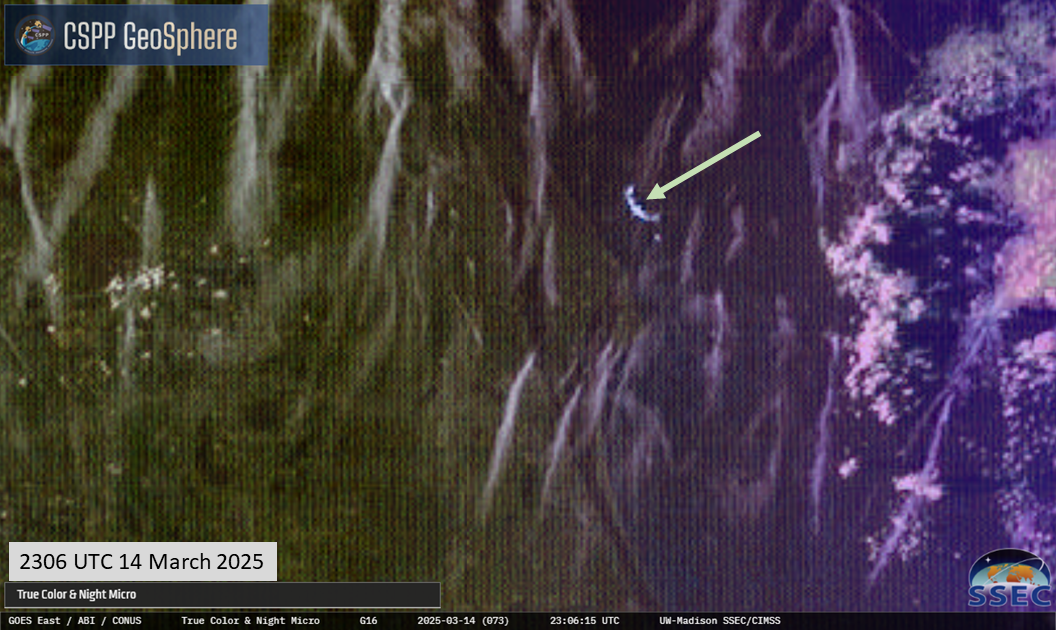
The strong winds responsible for the wildfires were also lofting large amounts of blowing dust across the Southern Plains. 5-minute CONUS Sector GOES-16 True Color RGB images from the CSPP GeoSphere site (below) displayed the broad swath of dense blowing dust (shades of tan) originating from New Mexico/Texas — as well as another plume of blowing dust moving south-southeastward from eastern Colorado to southwestern Kansas and northwestern Oklahoma (on the back side of a deep low pressure center). In addition, 2 large smoke plumes (pale shades of white) originating in Oklahoma were rising above the blowing dust as they eventually moved eastward and northeastward.

5-minute GOES-16 True Color RGB images, from 1501-2336 UTC on 14 March [click to play MP4 animation]
1-minute GOES-16 Visible images that included plots of Ceiling/Visibility (below) showed how the blowing dust and smoke restricted surface visibility at many locations across Oklahoma, down to values as low as 1/4 mile at times.

1-minute GOES-16 Visible images with overlays of 1-minute GOES-16 Fire Mask derived product and hourly plots of Ceiling/Visibility, from 1501 UTC on 14 March to 0000 UTC on 15 March [click to play MP4 animation]
===== 15 March Update =====

5-minute GOES-16 daytime True Color RGB + Nighttime Microphysics RGB images, from 1646 UTC on 14 March to 1646 UTC on 15 March [click to play MP4 animation]
A 24-hour animation of GOES-16 daytime True Color RGB + Nighttime Microphysics RGB images (above) showed the long-range transport of airborne dust from New Mexico/Texas to the western Great Lakes. Dust exhibited brighter shades of magenta in the Nighttime Microphysics RGB imagery.
A longer 36-hour animation of GOES-19 (Preliminary/Non-operational) Dust RGB images created using Geo2Grid (below) also highlighted the blowing dust as brighter shades of magenta. However, toward the end of the day on 15 March the magenta signature of the airborne dust became more muted as it moved northward from Wisconsin and Michigan toward far southern Ontario.
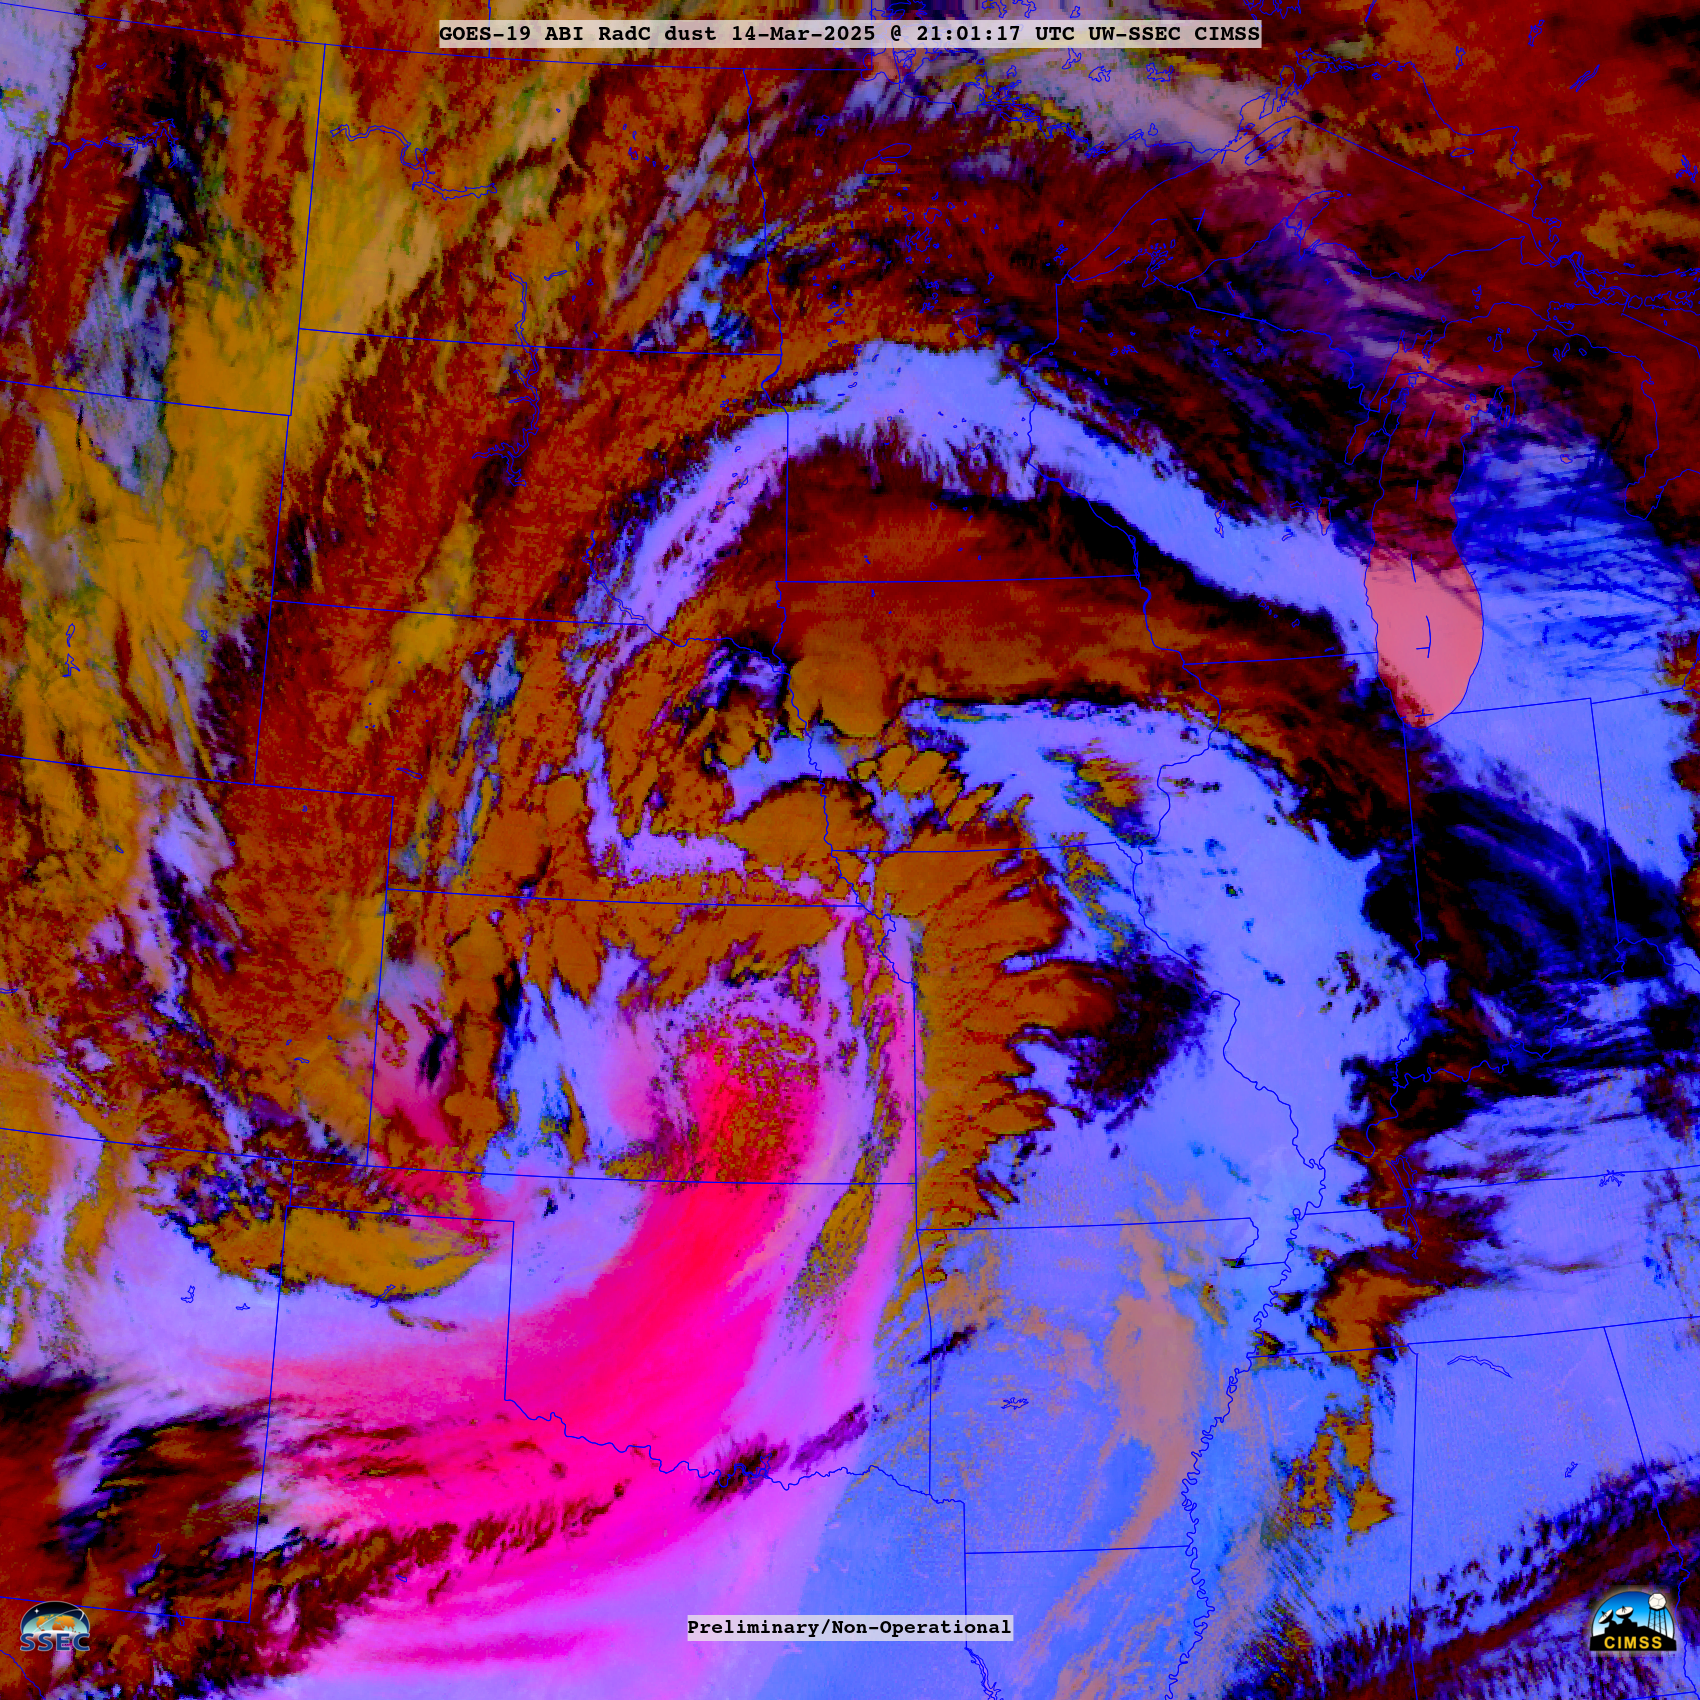
GOES-19 Dust RGB images, from 1201 UTC on 14 March to 2356 UTC on 15 March [click to play animated GIF | MP4]
View only this post
Read Less


