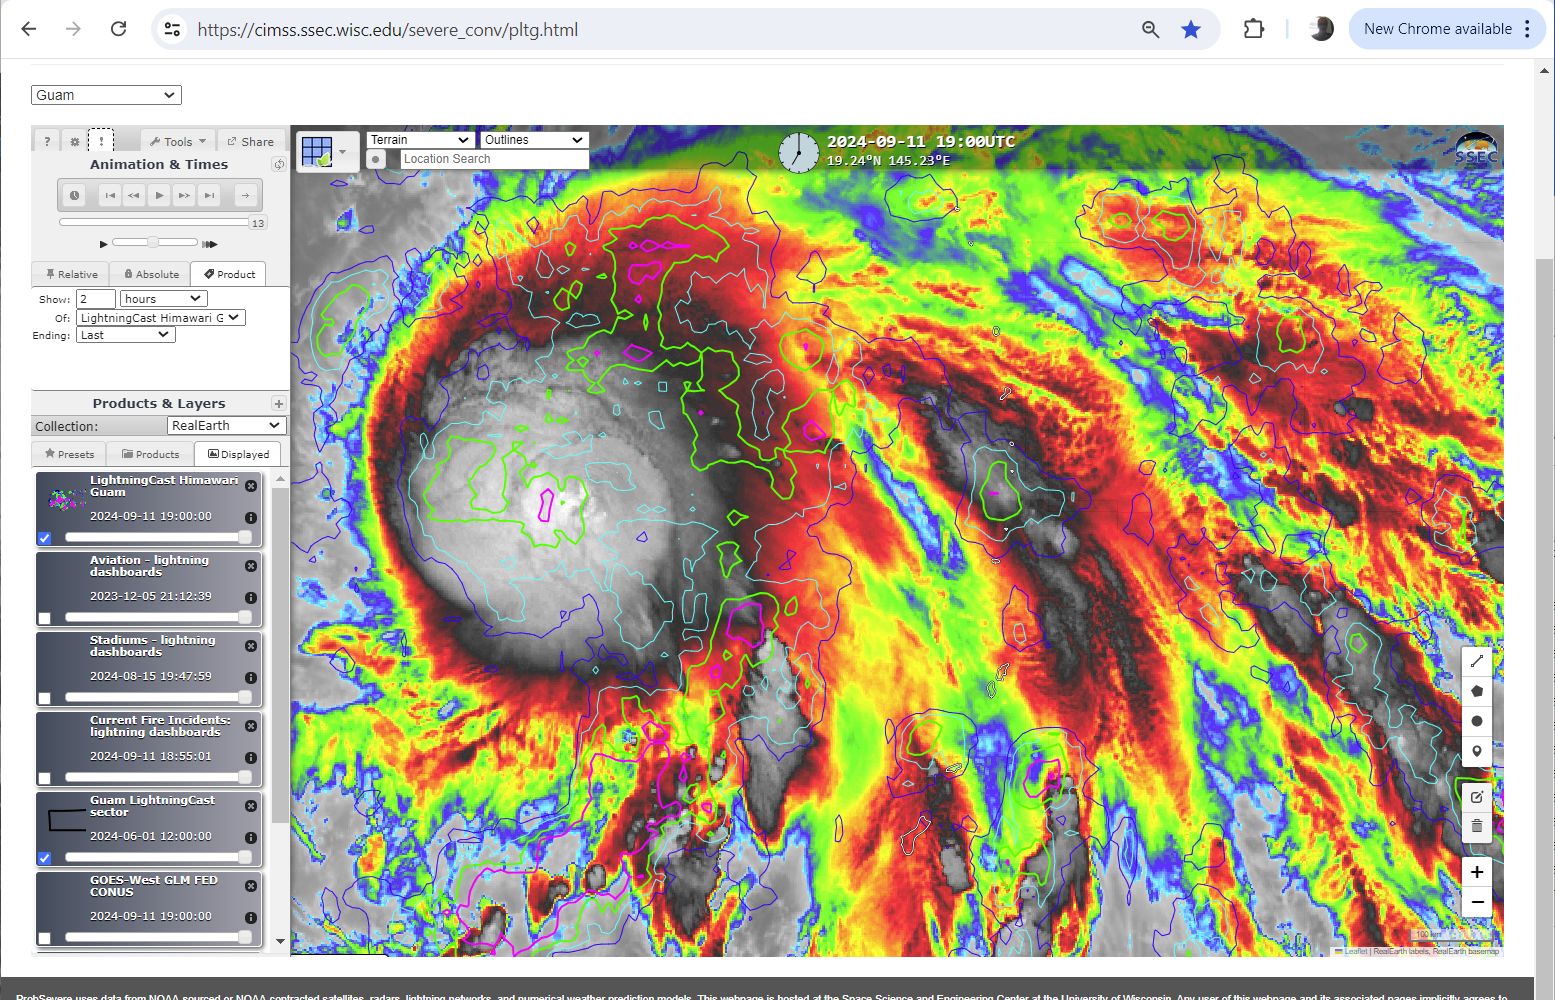
This website works best with a newer web browser such as Chrome, Firefox, Safari or Microsoft Edge. Internet Explorer is not supported by this website.

Post Fire in Southern California

1-minute Mesoscale Domain Sector GOES-18 (GOES-West) Day Fire RGB, Shortwave Infrared (3.9 µm), and “Red” Visible (0.64 µm) images with overlays of the Fire Power and Fire Mask derived product (2 components of the GOES Fire Detection and Characterization Algorithm FDCA) (above) displayed signatures of the Post Fire, which reportedly started around 2052 UTC on 15 June 2024 near Gorman, California (in far northwest... Read More

GOES-18 Day Fire RGB (top left), Shortwave Infrared (3.9 µm, top right), and “Red” Visible (0.64 µm) images with overlays of the Fire Mask (bottom left) and Fire Power derived products (bottom right), from 2057 UTC on 15 June to 0200 UTC on 16 June; Interstate 5 is plotted in violet [click to play animated GIF | MP4]

1-minute Mesoscale Domain Sector GOES-18 (GOES-West) Day Fire RGB, Shortwave Infrared (3.9 µm), and “Red” Visible (0.64 µm) images with overlays of the Fire Power and Fire Mask derived product (2 components of the GOES Fire Detection and Characterization Algorithm FDCA(above) displayed signatures of the Post Fire, which reportedly started around 2052 UTC on 15 June 2024 near Gorman, California (in far northwest Los Angeles County). The initial GOES-18 fire detection occurred at 2104 UTC — and the 3.9 µm Shortwave Infrared brightness temperature first reached 137.88ºC (the saturation temperature of GOES-18 ABI Band 7 detectors) at 2216 UTC. The wildfire caused evacuations to be ordered for areas just west of Interstate 5.

1-minute GOES-18 True Color RGB images (source) from 2130 UTC on 15 June to 0149 UTC on 16 June (below) showed the transport of dense smoke from the wildfire. Note the occasional pyrocumulus jumps near the fire source region.

1-minute GOES-18 True Color RGB images, from 2130 UTC on 15 June to 0149 UTC on 16 June [click to play MP4 animation]

1-minute GOES-18 Day Fire RGB images (below) included plots of METAR surface reporting sites. Although the smoke plume  passed directly over KSDB and KWJF, the bulk of the smoke remained aloft (at altitudes between 2000-8000 ft, therefore casting a shadow onto the ground below) and did not significantly reduce the surface visibility at either site.

1-minute GOES-18 Day Fire RGB images with METAR sites plotted in yellow, from 2200 UTC on 15 June to 0200 UTC on 16 June [click to play animated GIF | MP4]

A NOAA-21 VIIRS Day/Night Band image valid at 0944 UTC (2:44 AM local time) on 16 June (below) displayed the bright nighttime glow of the Post Fire (between Gorman and Pyramid Lake).

NOAA-21 VIIRS Day/Night Band (0.7 µm) image valid at 0944 UTC on 16 June [click to enlarge]

A 27-hour animation of 1-minute GOES-18 Shortwave Infrared (3.9 µm) images (below) showed the diurnal behavior of the Post Fire thermal signature as it continued to burn south-southeastward along the Interstate 5 corridor.

1-minute GOES-18 Shortwave Infrared (3.9 µm) images, from 2100 UTC on 15 June to 2359 UTC on 16 June [click to play animated GIF | MP4]

In a toggle between NOAA-20 VIIRS True Color and False Color RGB images (source) at 2014 UTC on 16 June (below), the Post Fire burn scar appeared as shades of gray to reddish-orange — while an active fire front along the southern edge (from which a smoke plume was emanating) exhibited brighter shades of pink.

NOAA-20 VIIRS True Color and False Color RGB images at 2014 UTC on 16 June [click to enlarge]

View only this post Read Less

The Bear Fire in California and NGFS detection

GOES-18 imagery over California at 1836 UTC (above, left) show a very strong signal over San Luis Obispo County: very bright in visible imagery and warm in the shortwave infrared. In the GOES-16 imagery, that signal is not present. In contrast, the warm signal in the shortwave infrared in GOES-18... Read More

GOES-18 Band 2 (visible, 0.64 µm, upper left) and Band 7 (Shortwave IR, 3.9 µm, lower left) and GOES-16 Band 2 (visible, 0.64 µm, upper right) and GOES-16 Band 7 (Shortwave IR, 3.9 µm, lower right) at 1836 UTC on 13 June 2024 (Click to enlarge)

GOES-18 imagery over California at 1836 UTC (above, left) show a very strong signal over San Luis Obispo County: very bright in visible imagery and warm in the shortwave infrared. In the GOES-16 imagery, that signal is not present. In contrast, the warm signal in the shortwave infrared in GOES-18 imagery below has a similar signal in the GOES-16 imagery. (Click here for a shortwave infrared animation from GOES-16 animation, and here from GOES-18). In the imagery above, the lack of a signal in GOES-16 might mean this is an example of reflection off solar panels In contrast, imagery below suggests a fire is present, as the detection is present in shortwave infrared imagery from both satellites.

GOES-18 Band 2 (visible, 0.64 µm, upper left) and Band 7 (Shortwave IR, 3.9 µm, lower left) and GOES-16 Band 2 (visible, 0.64 µm, upper right) and GOES-16 Band 7 (Shortwave IR, 3.9 µm, lower right) at 2031 UTC on 13 June 2024 (Click to enlarge)

The Next Generation Fire System (NGFS) is a NOAA/NESDIS initiative to streamline the detection of fires as soon as they occur. The NGFS Alerts Dashboard (Documentation on the NGFS is here) shows the results of continuous automatic monitoring of satellite data for the development of hot spots such as those seen in the still images and animations above. What kind of information was available for the two events above, one a result of reflection off solar panels, and one a result of a fire? NGFS output at 1831 (Microphysics RGB) and 1836 UTC (Fire Temperature RGB and Visible imagery) is shown below.

NGFS Microphysics RGB (1831 UTC) and Fire T RGB and Visible imagery (1836 UTC); the orange boxes show the some of the visible and all of the infrared pixels’ locations (Click to enlarge)

The NGFS report allows a user to scroll forward and back in time. The NGFS Microphysics imagery at 1821 UTC, when the detection above first happened, is shown below. A simple probe shows that this detection is associated with a solar farm based both on a spectral analysis and a knowledge of where solar panels exist (if you look as the Google Basemap, available in the menu below, and zoom in, you’ll see the panels); given the sudden strong onset of a signal, perhaps a Fire Meteorologist would feel justified in ignoring the signal at these pixels (one clue is the vertical striping emanating northward/southward from the bright signature in Visible imagery, due to detector saturation from intense reflection of sunlight off the large Topaz Solar Farm). Note that information from more than one satellite band is needed to be certain that a solar farm is being detected.

NGFS Microphysics RGB for a detection in San Luis Obispo CA, 1821 UTC, 12 June 2024, plus a description of the Event Type (Click to enlarge)

Not long after, an actual fire did occur southeast of the Solar Panel detection (Note Highway 58 in all images!). The NGFS detection for that incident is shown below. It is detected as a Fire Pixel in this case.

NGFS Microphysics RGB from GOES-18 data, 1921 UTC on 12 June 2024 (Click to enlarge)

The detected hot spot can be probed to detect the flammability of the pixels, as shown below.

Probe data associated with a fire hot spot, NGFS Microphysics RGB from GOES-18 data, 1921 UTC on 12 June 2024 (Click to enlarge)

One the fire has been named, that name (Bear Fire) is also included in the information on the NGFS website, and in the probe, as shown below.

Probed Microphsysics RGB at NGFS website, 2200 UTC on 12 June 2024 (click to enlarge); note Fire Name: BEAR (Click to enlarge)

NOAA/NESDIS sponsored a Fire Weather Testbed in Boulder, CO the week of 10-14 June 2024 that included demonstrations of the NGFS detections, alerts dashboard, and satellite imagery on the NGFS website.

View only this post Read Less

6-panel SUVI (Solar) Imagery

There are a number of instruments on the GOES-R series to monitor space weather, one of them is the Solar UV Imager (SUVI).6-panel SUVI ImageryThe same loop as above, but as an animated gif. The SUVI monitors the Sun at 6 frequencies in the UV part of the electromagnetic spectrum. UW/SSEC has started to post daily... Read More

There are a number of instruments on the GOES-R series to monitor space weather, one of them is the Solar UV Imager (SUVI).

6-panel SUVI Imagery

The 6 bands of the SUVI, once per day, from May 16 to June 11, 2024.

The same loop as above, but as an animated gif. The SUVI monitors the Sun at 6 frequencies in the UV part of the electromagnetic spectrum. UW/SSEC has started to post daily 6-panel (Multi-Channel) SUVI images on their “Geo”-browser for both GOES-East and -West. The data are brought in via the GRB data stream.

Individual SUVI Bands

SUVI animation from June 12, 2024 for the 303 Angstrom band. (Click to Play animation)

A table of the SUVI band uses demonstrates which bands monitor filaments, coronal holes, active regions, coronal mass ejections, flares and quiet regions. Near realtime individual SUVI bands are available at the links to the UW Geobrowser above, but also available at the SWPC.

RGB 3-band Composite SUVI Imagery

An RGB of 3 SUVI bands (131, 195 and 303 Angstroms) on May 13, 2024. (Click to Play animation)

As is done with ABI imagery, compositing a number of spectral bands can be done to create a Red-Green-Blue (RGB) image. The various combinations can bring out the various solar features.

An example of a SUVI RGB from 3 of its spectral bands. (Click to Play animation)

You can generate your own daily SUVI RGB image: GOES-East or -West. Or access a few static cases: April 8, 2024 (Total Solar Eclipse in North America) or May 8, 2024 (Coronal Mass Ejection that led to Auroras on May 13) or May 14, 2024 (strongest flare of this solar cycle to date).

H/T

Thanks to all who make the satellite imagery possible, the ingest and software to display the imagery (including, but not limited to McIDAS-X and Here GOES Radio). Special thanks to the UW/SSEC Satellite Data Services for bringing in the SUVI data. T. Schmit works for NOAA/NESDIS/STAR and is stationed in Madison, WI. Kudos to M. Weinreb, who helped co-name the SUVI.

View only this post Read Less

Heavy rainfall across American Samoa

1-minute Mesoscale Domain Sector GOES-18 (GOES-West) “Clean” Infrared Window (10.3 µm) images (above) displayed areas of convection that moved across the islands of American Samoa on 12 June 2024 (1-minute imagery was requested by NWS Pago Pago to monitor the approach of thunderstorms capable of producing heavy rainfall and potential flooding — and since they lack radar coverage, 1-minute satellite... Read More

1-minute GOES-18 “Clean” Infrared Window (10.3 µm) images combined with the 1-minute Total Precipitable Water derived product (in cloud-free regions), from 0900-1400 UTC on 12 June; NSTU denotes the location of Pago Pago, American Samoa [click to play animated GIF | MP4]

1-minute Mesoscale Domain Sector GOES-18 (GOES-West) “Clean” Infrared Window (10.3 µm) images (above) displayed areas of convection that moved across the islands of American Samoa on 12 June 2024 (1-minute imagery was requested by NWS Pago Pago to monitor the approach of thunderstorms capable of producing heavy rainfall and potential flooding — and since they lack radar coverage, 1-minute satellite imagery can be very valuable in that type of scenario). Pago Pago (NSTU) did receive heavy rainfall (2.84 inches) from thunderstorms during the 1045-1155 UTC period (METARsplot of surface report data); in-cloud lightning was also noted with those particular thunderstorms. Flood Advisories for American Samoa were issued at 0912 UTC and 1200 UTC.

The 1-minute GOES-18 Total Precipitable Water (TPW) derived product (in cloud-free regions) showed a N-to-S oriented corridor of TPW values in the 2.0 to 2.2 inch range (lighter shades of violet) across the islands of Western Samoa — however, the presence of extensive cloudiness across the islands of American Samoa prevented the retrieval of TPW there. The TPW value derived from NSTU rawinsonde data at 0000 UTC on 12 June was 2.48 inches (below).

Plot of rawinsonde data from Pago Pago, American Samoa at 0000 UTC on 12 June [click to enlarge]

A GOES-18 Infrared image showing a cold (-80.35ºC) thunderstorm overshooting top just southwest of the American Samoa island of Tutuila at 1112 UTC on 12 June (below) included a cursor sample of the associated GOES-18 Cloud Top Height (53191 ft) and Rain Rate (3.05 in/hr) derived products at that location. That rain rate was consistent with the ~1-hour rainfall amount (2.84 in) that was observed at NSTU.  Note that the cold overshooting top and high rain rate were displaced about 6-8 mi southwest of NSTU and the island of Tutuila — for a Cloud Top Height around 50 kft, this is consistent with a parallax adjustment of ~13 km with GOES-West imagery over American Samoa.

GOES-18 “Clean” Infrared Window (10.3 µm) image showing a cold thunderstorm overshooting top just southwest of the American Samoa island of Tutuila at 1112 UTC on 12 June, which included a cursor sample of the associated GOES-18 Cloud Top Height (light blue) and Rain Rate (cyan) derived products [click to enlarge]

A curious aspect of this deep convection was the appearance of cloud-top standing waves south of the Manu`a Islands, during the 1100-1300 UTC period. These standing waves can be seen in a toggle between GOES-18 “Clean” Infrared Window (10.3 µm) and Mid-level Water Vapor (6.9 µm) images at 1152 UTC (below) — a feature of unknown etiology that earns it a spot in the coveted “What the heck is this?” blog post category.

GOES-18 “Clean” Infrared Window (10.3 µm) and Mid-level Water Vapor (6.9 µm) images at 1152 UTC on 12 June [click to enlarge]

View only this post Read Less