NUCAPS Profiles over Guam
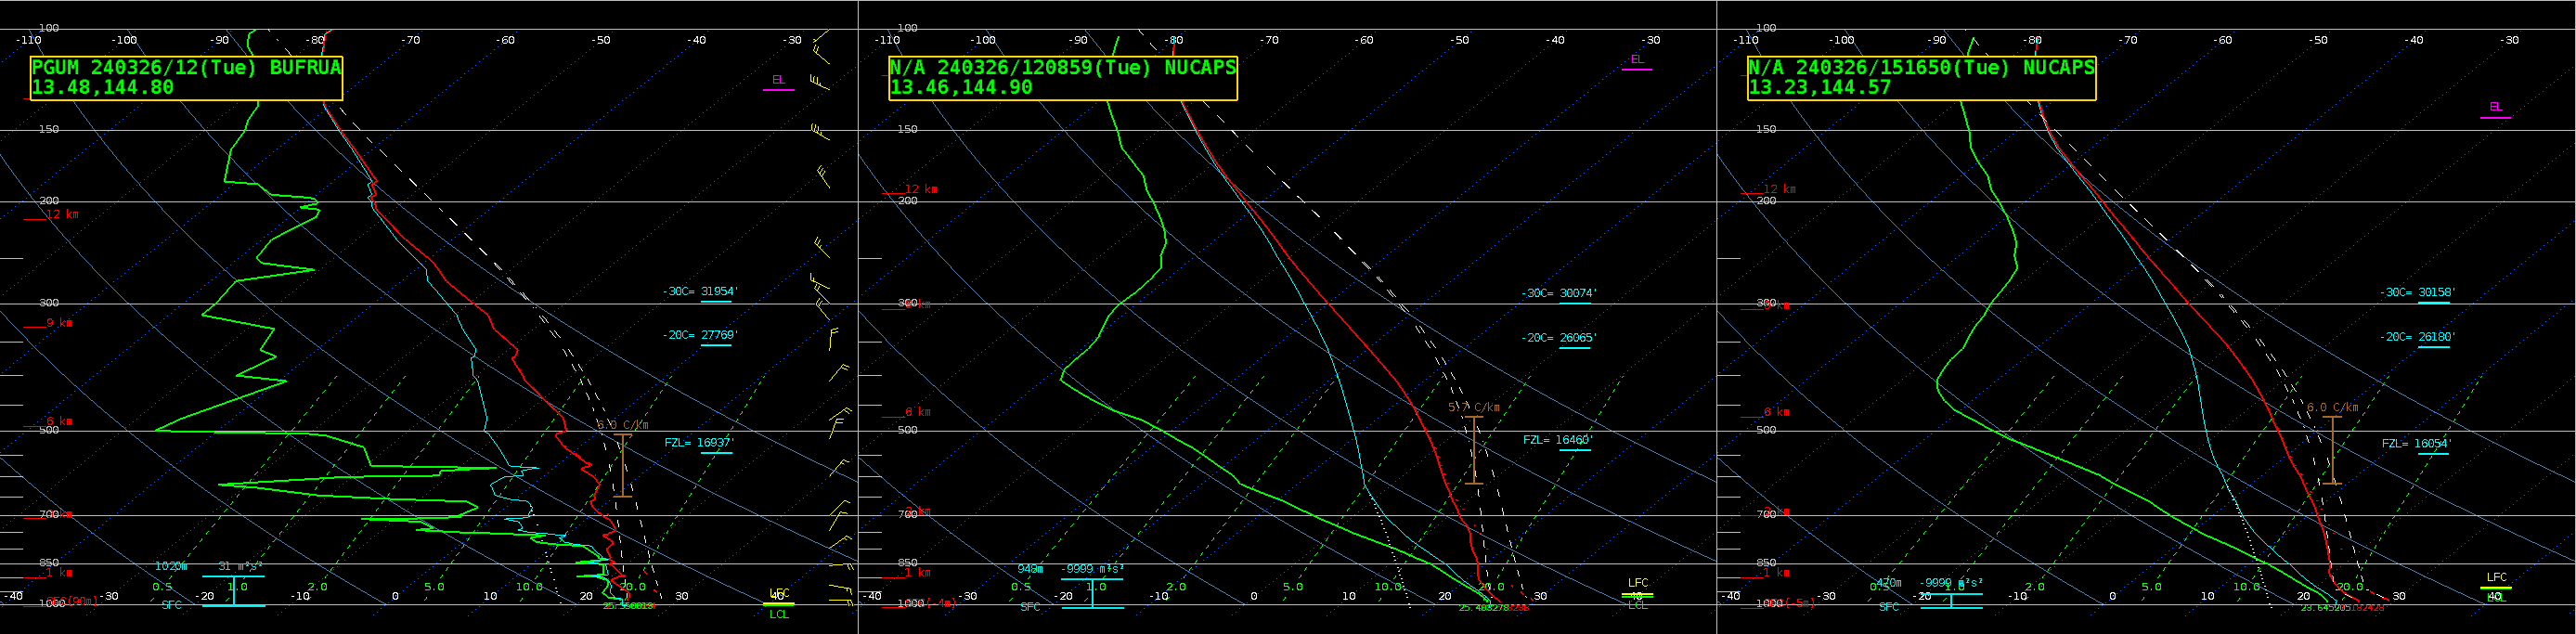
The addition of a 2nd satellite (MetopC) producing NUCAPS profiles means that places such as Guam have twice as much Satellite information over the otherwise data-sparse western Pacific Ocean. The three-panel above shows the 1200 UTC sounding at Guam (on the left) with a nearly coincident 1208 UTC NUCAPS profile from NOAA-20 data in the middle, and a 1516 UTC MetopC NUCAPS profile on the right. It’s a lot easier to use these satellite soundings to infer how things are changing because of the increased number of soundings available. The toggle below compares the two NUCAPS profiles.
The Sounding Availability Plot from AWIPS, below, shows the distribution of points from the NOAA-20 and MetopC overpasses centered on the island of Guam. The points chosen above were the closest ones to the island of Guam.
Gridded NUCAPS fields are also created in AWIPS from these vertical profiles. Those fields allow a user to easily pick out gradients and thresholds.