SpaceX Starship Test Flight 3
1-minute GOES-16 images of ABI spectral bands 01-16 and a Rocket Plume RGB, from 1324-1329 UTC on 14 March; KBRO denotes the Brownsville TX rawinsonde site [click to play animated GIF | MP4]
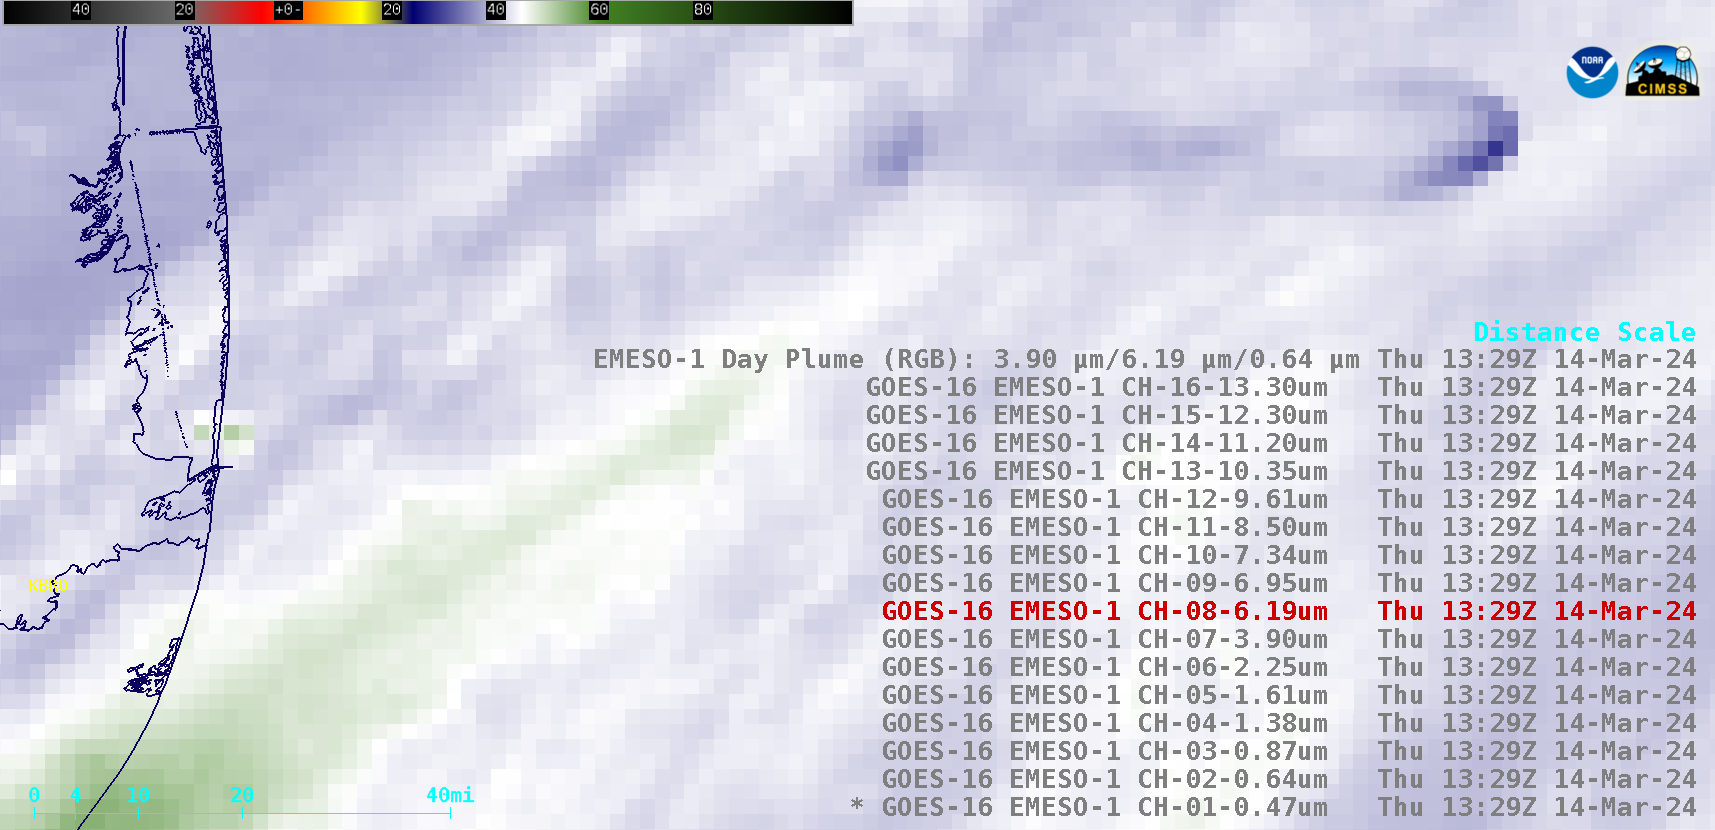
In Band 8 (Upper-level Water Vapor) imagery, note the change in exhaust plume shape with time and atmospheric layer: at early altitudes of 20-50 km (where the Stratosphere had more density, and therefore higher ambient pressure), the Stage 1 booster plume was more linear — but after the 1328 UTC “hot stage separation” as the Stage 2 rocket reached higher altitudes of 70-80 km (where the Mesosphere was much less dense, with lower ambient pressure) the plume was able to expand outward into more of a curved “boomerang” shape beginning at 1329 UTC.
A close-up view using a sequence of three 16-panel displays of all GOES-16 ABI spectral bands (below) showed that a warm thermal signature of the hot stage separation process was apparent at 1328 UTC in Near-Infrared bands 04-06 and Infrared bands 07-16 (just to the right of center in each image panel).
16-panel display of all GOES-16 ABI spectral bands, every minute from 1327-1329 UTC on 14 March [click to enlarge]
Interleaved GOES-16 Mesoscale Sector and CONUS Sector Upper-level Water Vapor (6.2 µm) images, from 1325-1332 UTC on 14 March [click to play animated GIF | MP4]