Satellite signatures of the SpaceX Starship 2 test launch
30-second GOES-16 images of ABI spectral bands 01-16 and a Rocket Plume RGB, from 1301-1308 UTC on 18 November; KBRO denotes the Brownsville TX rawinsonde site [click to play animated GIF | MP4]
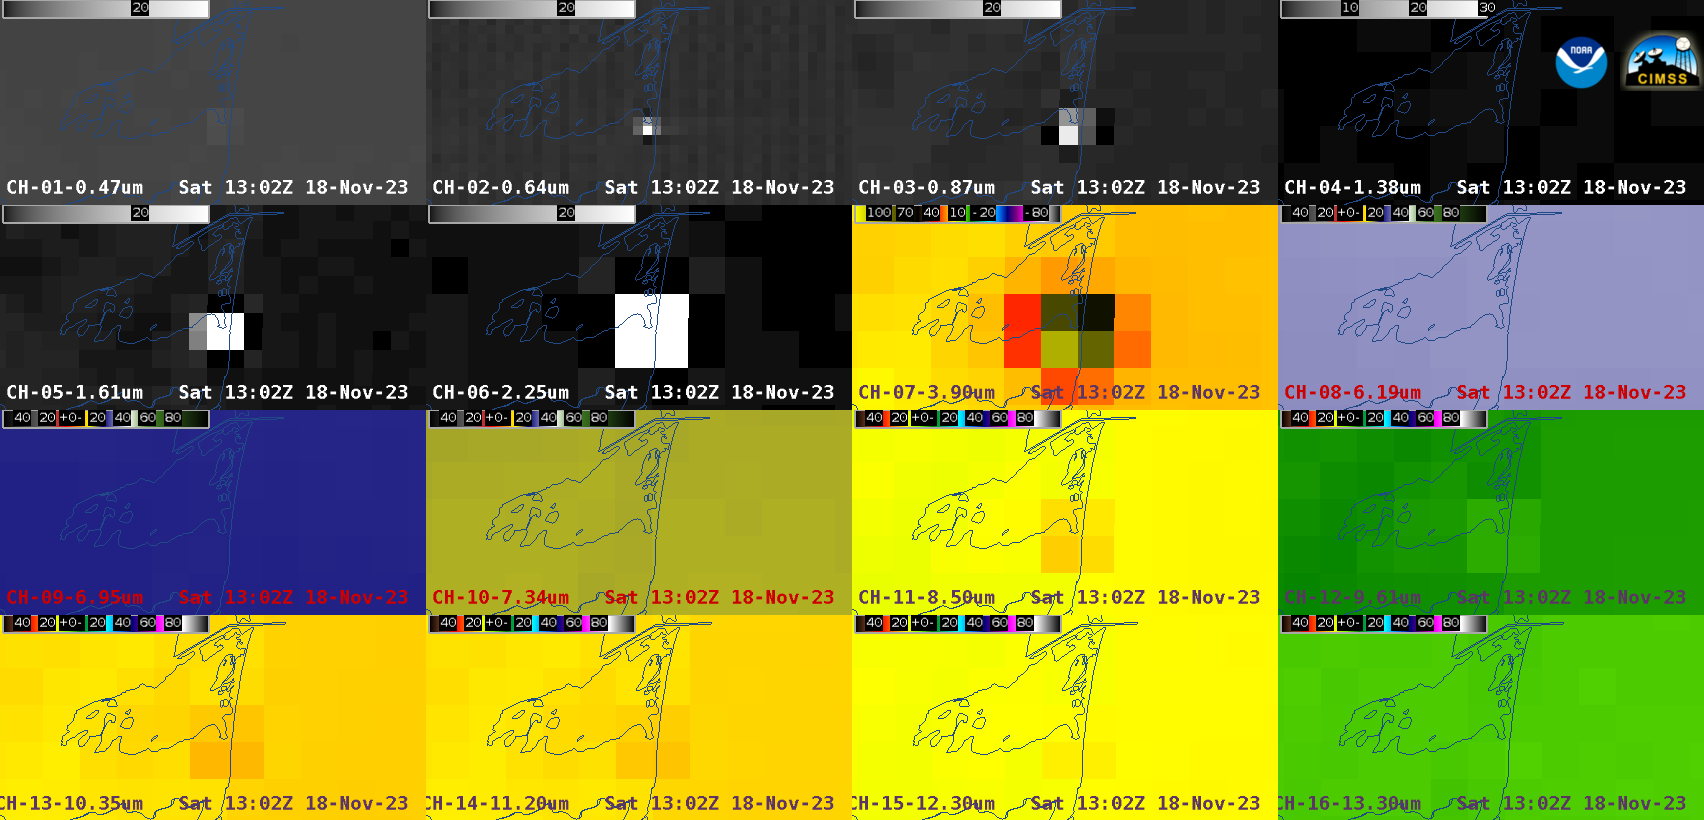
A close-up view using 16-panel displays of all GOES-16 ABI spectral bands (below) showed that a reflectance signature of the Stage 1 rocket booster was evident in most of the Visible and Near-Infrared bands (01/02/03/05/06) at 13:02:55 UTC, along with a warm thermal signature in Infrared bands 07 and 11-15. After that time, warm thermal signatures then became apparent in all Near-Infrared and Infrared spectral bands (03-16) as the rocket began its ascent.
16-panel display of all GOES-16 ABI spectral bands, every 30 seconds from 1301-1303 UTC on 18 November [click to play animated GIF | MP4]
30-second GOES-16 Upper-level Water Vapor (6.2 µm), Mid-level Water Vapor (6.9 µm), Low-level Water Vapor (7.3 µm) and Rocket Plume RGB images, from 1301-1309 UTC on 18 November [click to play animated GIF | MP4]
GOES-16 Upper-level Water Vapor (6.2 µm) and Shortwave Infrared (3.9 µm) images at 13:05:25 UTC, when the Stage 1 rocket booster was firing in the Mesosphere at an altitude of 61 km [click to enlarge]
GOES-16 Upper-level Water Vapor (6.2 µm) and Shortwave Infrared (3.9 µm) images at 13:06:25 UTC, when the Stage 2 rocket booster was firing in the Thermosphere at an altitude of 101 km [click to enlarge]
GOES-16 Upper-level Water Vapor (6.2 µm) and Shortwave Infrared (3.9 µm) images at 13:07:25 UTC, when the Stage 2 rocket booster was firing in the Thermosphere at an altitude of 128 km [click to enlarge]
GOES-16 Upper-level Water Vapor (6.2 µm) and Shortwave Infrared (3.9 µm) images at 13:09:25 UTC, when the Stage 2 rocket booster was firing in the Thermosphere at an altitude of 149 km [click to enlarge]