Satellite signatures of moist soil (and patches of snow cover) across Iowa

GOES-16 Day Snow-Fog RGB and Land Surface Temperature images [click to play animated GIF | MP4]
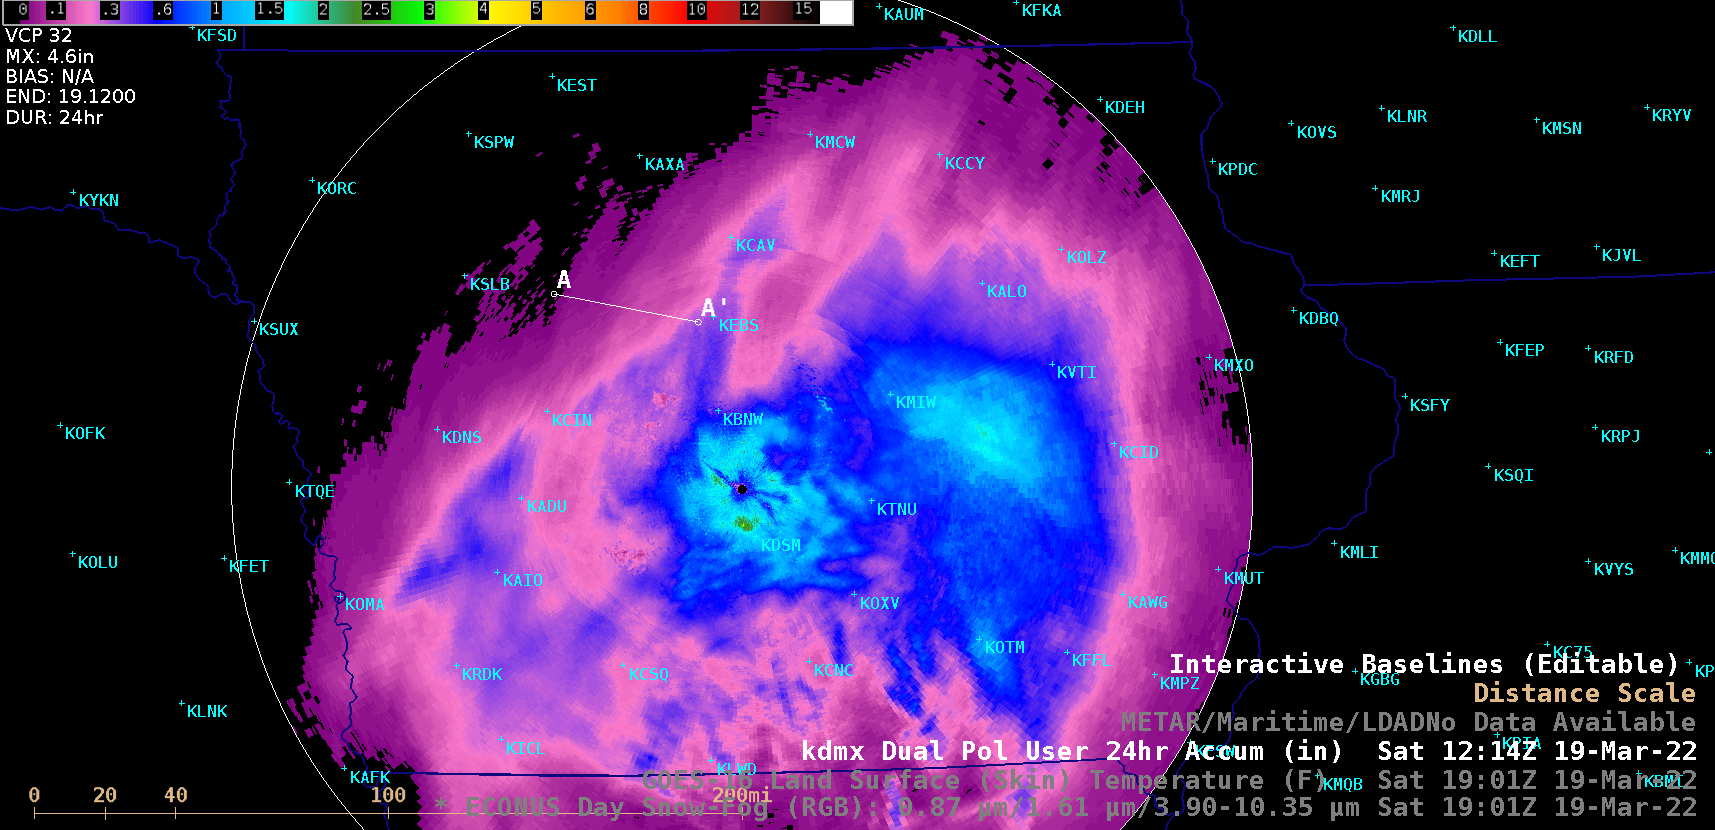
The corresponding hourly Land Surface Temperature (LST) derived product displayed a similarly sharp contrast between the dry and moist soil — with the dry soils exhibiting late-morning to mid-afternoon LST values that were 15-25ºF warmer than adjacent moist soils (since the energy of incoming solar radiation was acting to evaporate water from the moist soil, rather than warm it). For example, in the Land Surface Temperature product at 1901 UTC (below) the LST along the 40-mile Baseline segment A-A’ varied from 88ºF in dry soil (at Point A) to 63ºF in moist soil (at Point A’). The radar-derived 24-hour total precipitation showing Baseline A-A’ can be seen here.
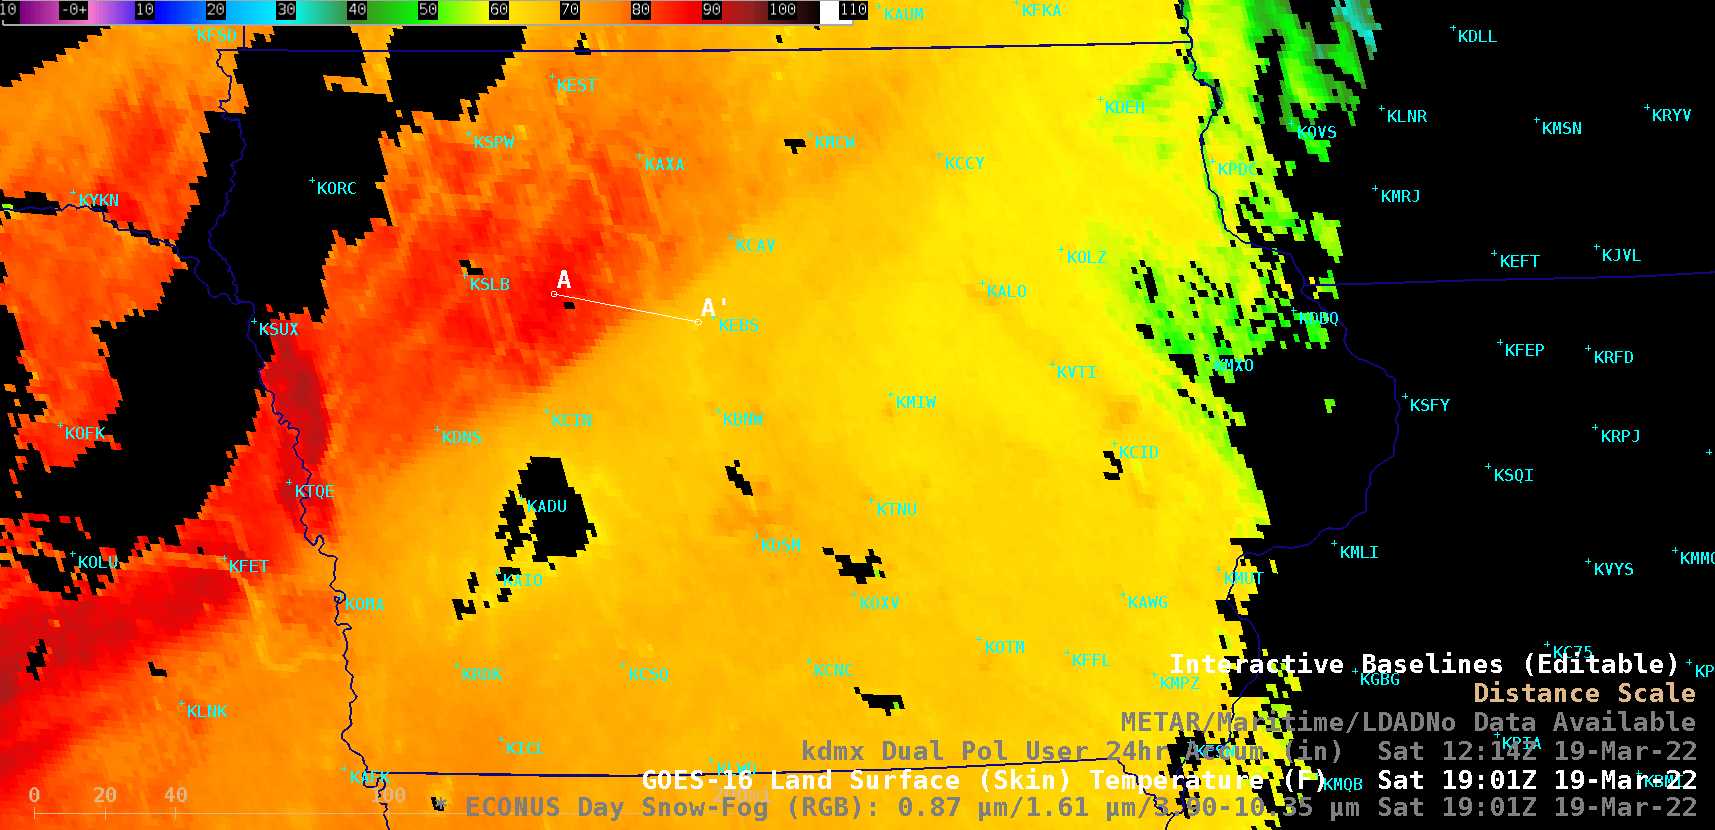
GOES-16 Land Surface Temperature product at 1901 UTC [click to enlarge]