Severe thunderstorms in the northern High Plains
1-minute GOES-16 “Red” Visible (0.64 µm, top) and “Clean” Infrared Window (10.3 µm, bottom) images with time-matched (+/- 3 minutes) SPC Storm Reports plotted in red/blue, from 1900-2352 UTC on 10 June [click to play animated GIF | MP4]
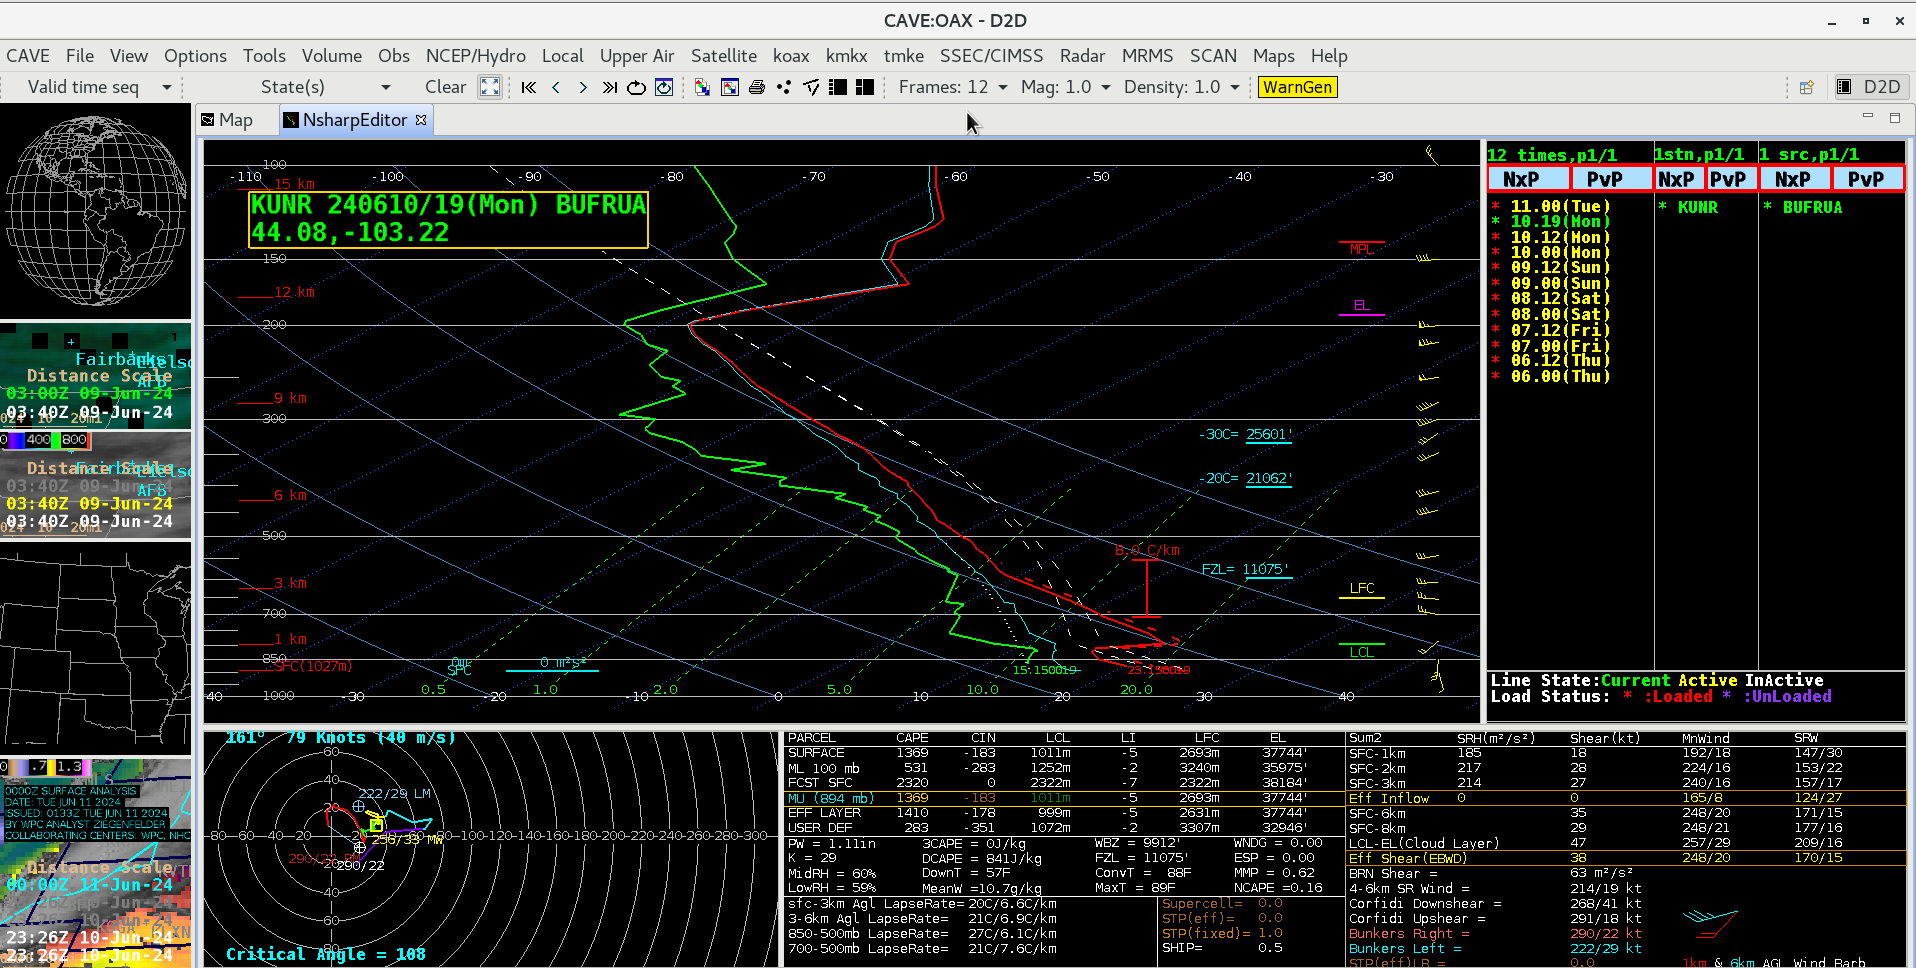
Plot of rawinsonde data from Rapid City, South Dakota at 1900 UTC on 10 June [click to enlarge]
5-minute GOES-16 “Red” Visible (0.64 µm) images, combined with the Total Precpitable Water derived product in cloud-free areas, from 1801 UTC on 10 June to 0001 UTC on 11 June [click to play animated GIF | >MP4]
5-minute GOES-16 “Red” Visible (0.64 µm) images, combined with the Lifted Index and Convective Available Potential Energy (CAPE) derived products in cloud-free areas, from 1801 UTC on 10 June to 0001 UTC on 11 June [click to play animated GIF | MP4]