Smoke-enhanced fog plume causes multi-vehicle accidents along I-10 near New Orleans
GOES-16 “Red” Visible (0.64 µm) images, from 1231 UTC to 1601 UTC [click to play animated GIF | MP4]
A plot of rawinsonde data from New Orleans at 1200 UTC (below) indicated that there was a pronounced and very shallow temperature inversion just above the surface, which was trapping the dense wildfire smoke+fog near the surface and preventing its vertical dispersion (until a few hours after sunrise, when boundary layer mixing began to increase).
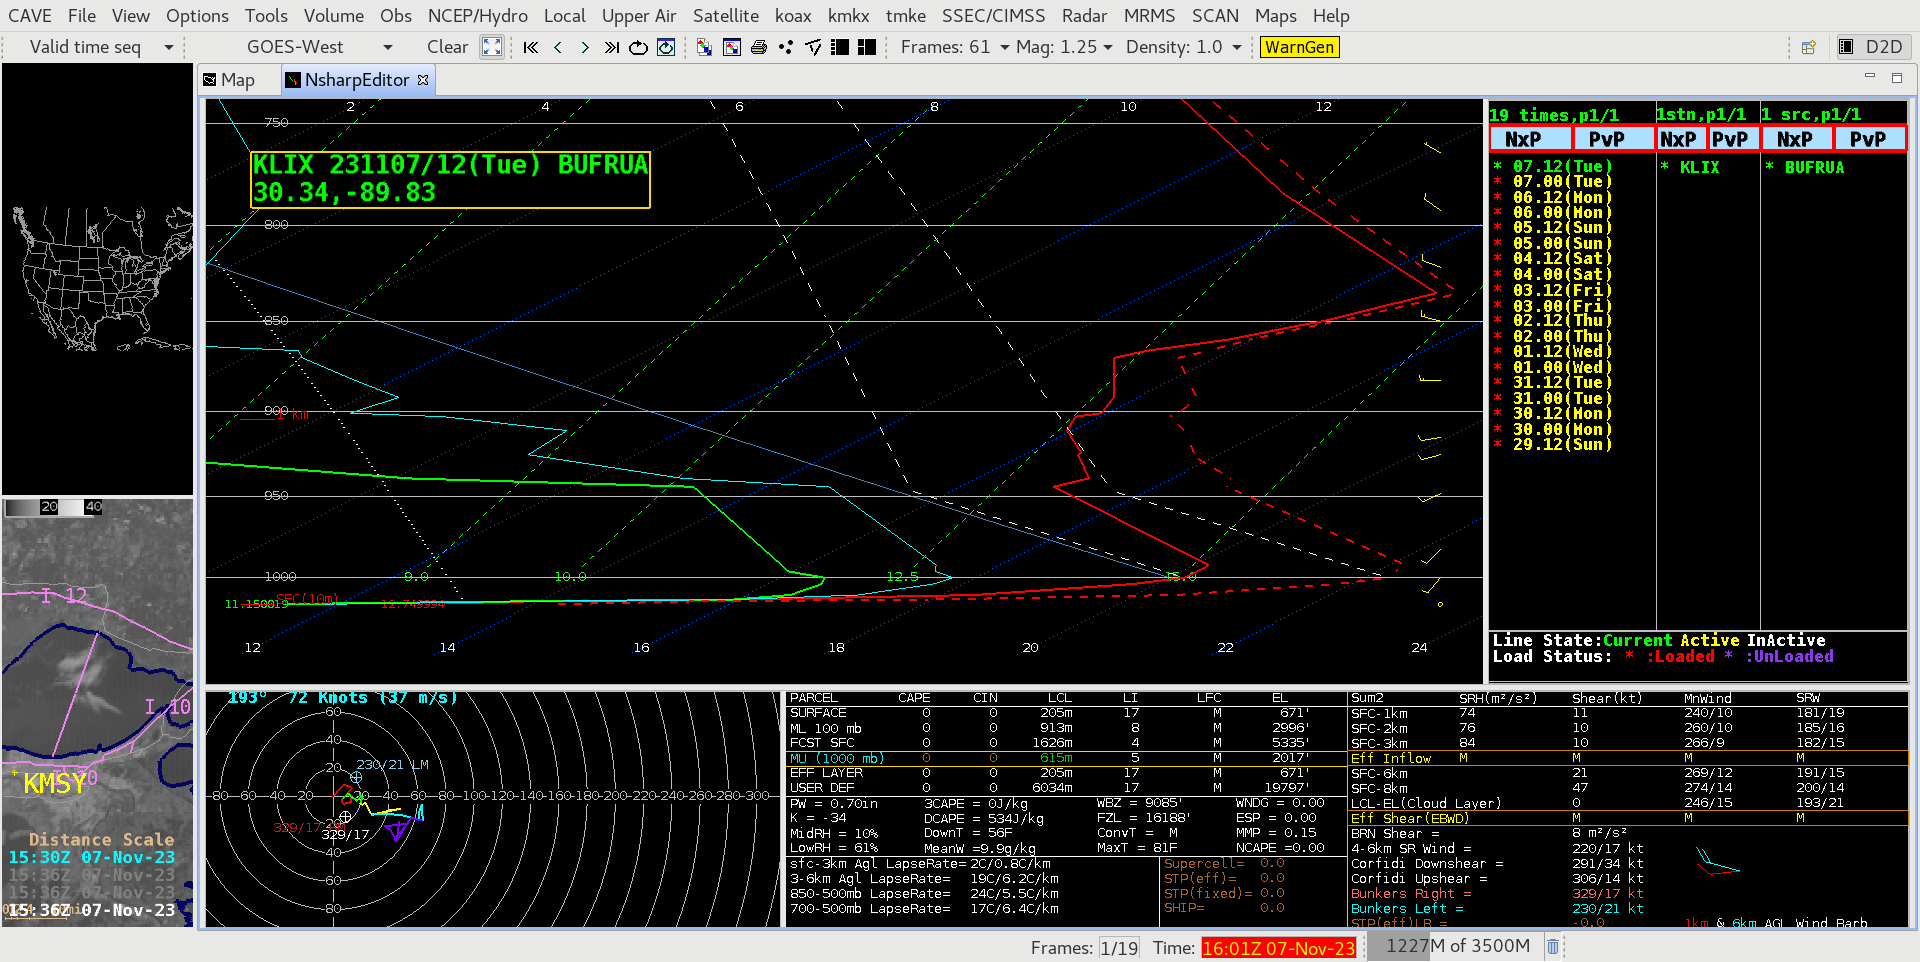
Plot of rawinsonde data from New Orleans at 1200 UTC [click to enlarge]
===== 08 Nov Update =====
GOES-16 Nighttime Microphysics RGB and daytime “Red” Visible (0.64 µm) images, from 1026 UTC to 1631 UTC [click to play animated GIF | MP4]
Unlike the previous day — when a veil of high clouds frequently prevented a view of low clouds/fog — a more distinct fog signature was seen in GOES-16 Night Fog Difference images (below).
GOES-16 Night Fog Difference (11.2-3.9 µm) images, from 1001-1236 UTC [click to play animated GIF | MP4]