Lake effect snow across Wisconsin and Upper Michigan
NOAA-20 VIIRS Day/Night Band (0.7 µm) and Infrared Window (11.45 µm) images valid at 0805 UTC [click to enlarge]
During the subsequent daytime hours, GOES-16 True Color RGB images from the CSPP GeoSphere site (below) displayed the lake effect snow (LES) bands that were streaming southwestward from Lake Nipigon and across the western portion of Lake Superior. The dominant LES band produced snowfall amounts as high as 10 inches in western Upper Michigan and 13.8 inches in northwestern Wisconsin.
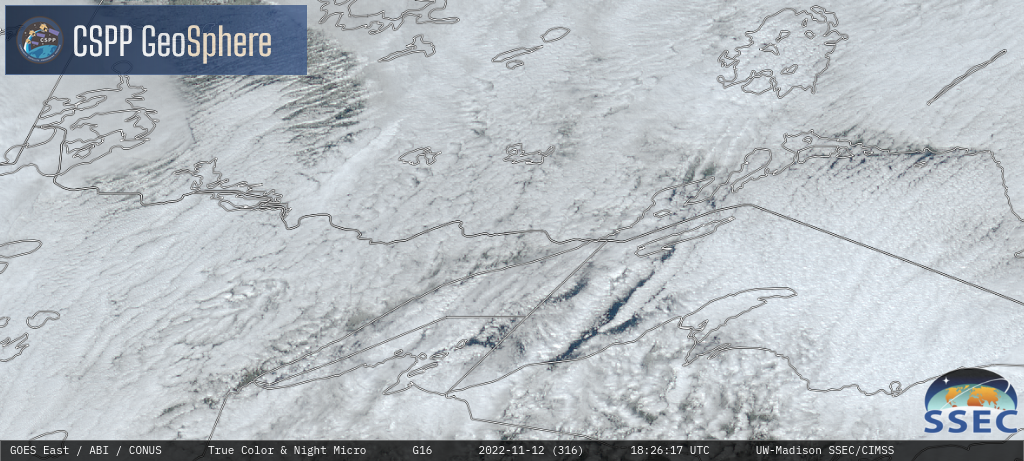
GOES-16 True Color RGB images [click to play MP4 animation]
GOES-16 Day Cloud Phase Distinction RGB images [click to play animated GIF | MP4]
————————————————————————
GOES-16 Day Cloud Phase Distinction RGB, Cloud Top Pressure, Cloud Top Height, Cloud Top Phase and Cloud Optical Depth at 1756 UTC [click to enlarge]
Cursor-sampled values of GOES-16 Day Cloud Phase Distinction RGB components, Cloud Top Pressure, Cloud Top Height and Cloud Top Phase (below) showed typical values of those parameters along the dominant LES band at 1756 UTC.
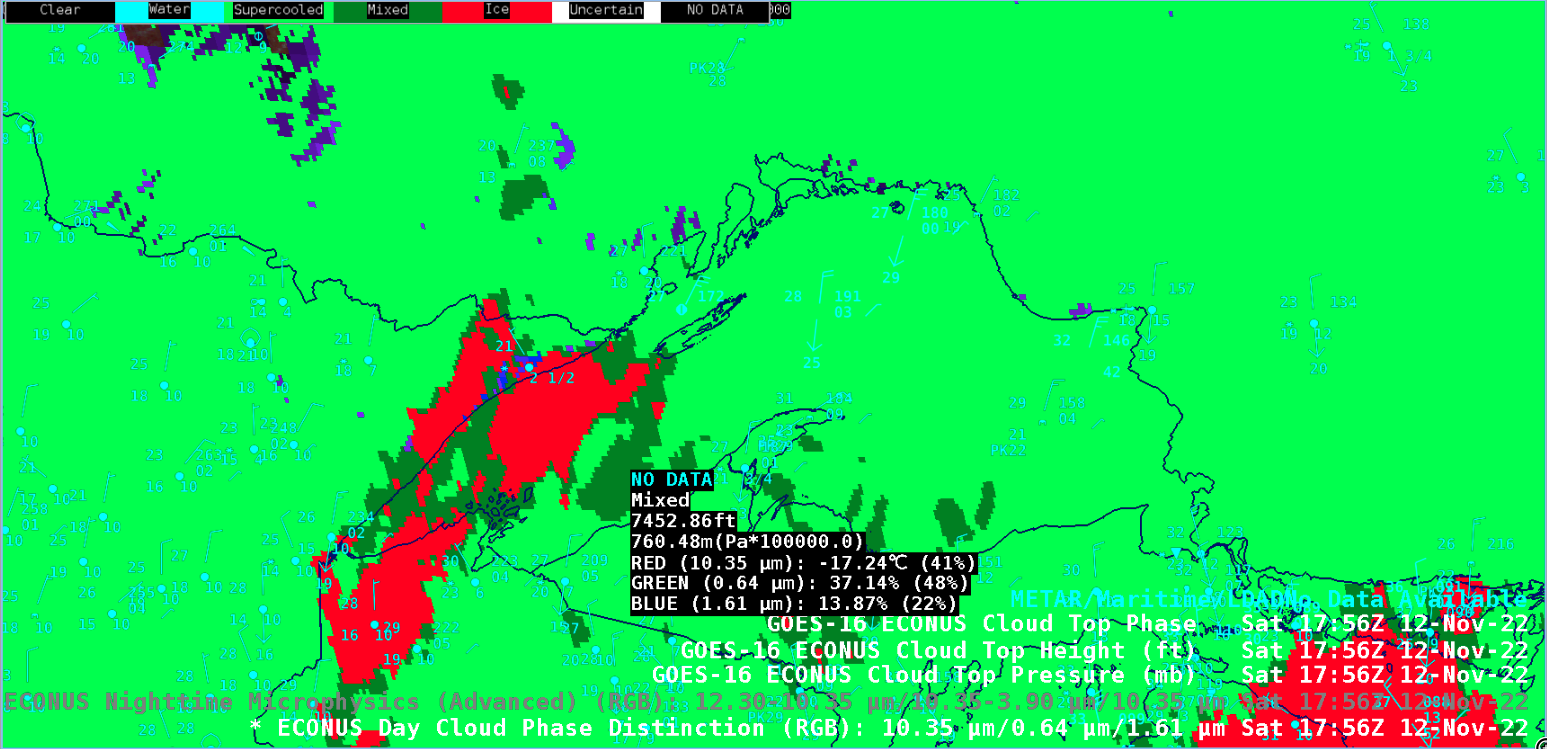
Cursor-sampled values of GOES-16 Day Cloud Phase Distinction RGB, Cloud Top Pressure, Cloud Top Height and Cloud Top Phase at 1756 UTC [click to enlarge]

GOES-16 Day Cloud Phase Distinction RGB image at 1831 UTC, with cursor-sampled values of Cloud Top Phase (green) and Cloud Top Height (cyan) along with the RGB image components [click to enlarge]

GOES-16 Cloud Top Pressure derived product [click to play animated GIF | MP4]

GOES-16 Cloud Top Height derived product [click to play animated GIF | MP4]
GOES-16 Cloud Top Phase derived product [click to play animated GIF | MP4]
GOES-16 Day Cloud Phase Distinction RGB images, with an overlay of the GOES-16 Cloud Optical Depth derived product [click to play animated GIF | MP4]