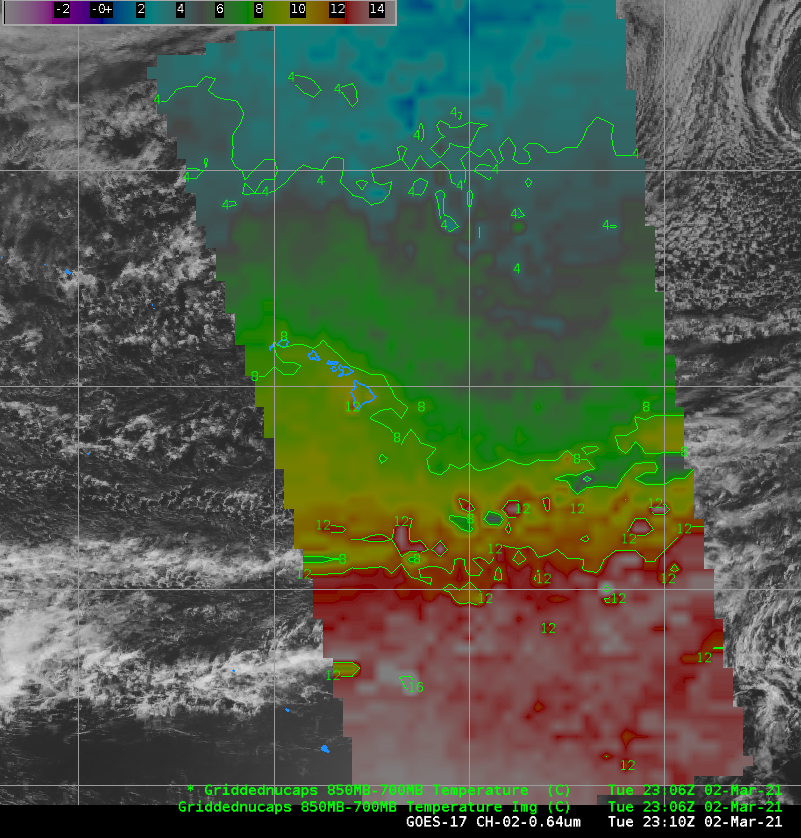
NUCAPS moisture and cloud fields over the central Pacific Ocean
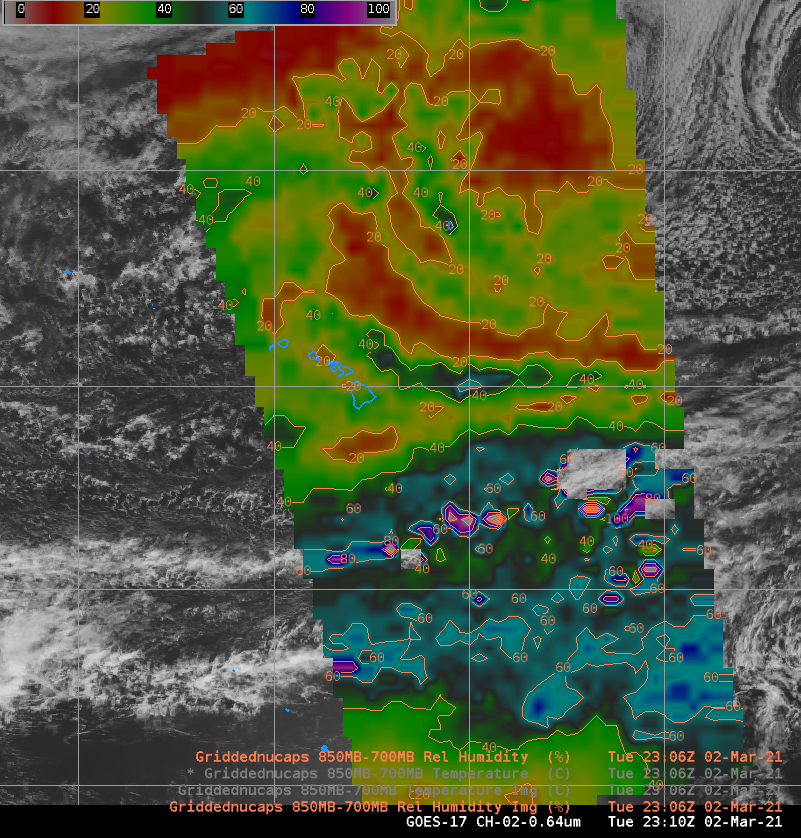
GOES-17 Visible Imagery (0.64 µm), 2310 UTC on 2 March 2021, along with gridded values of NUCAPS Temperature and Relative Humidity (both averaged between (850-700 mb) at 2306 UTC on 2 March 2021 (Click to enlarge)
NOAA-Unique Combined Atmospheric Processing System (NUCAPS) data from CrIS and ATMS on NOAA-20 can give temperature and moisture information in regions otherwise lacking data. How well do those fields estimate the actual distribution of temperature and moisture? The toggle above compared visible imagery with gridded fields of temperature and moisture from NUCAPS from late in the day on 2 March 2021.
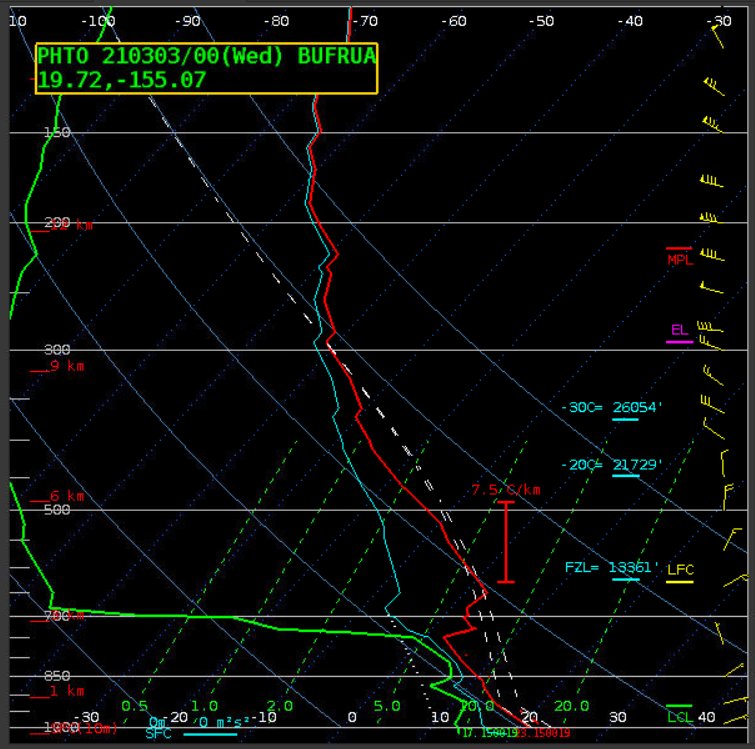
The thermal fields depict the frontal zone far to the south of Hawaii; cooler air where shallow cumulus convection is occurring is farther north. Of particular note is the excellent spatial correspondence between diagnosed dry air around and just to the northeast of Hawaii and an obvious lack of cloudiness there! (Here is the 0000 UTC 3 March 2021 sounding from Hilo; a strong inversion is just below 700 mb.)