Stereoscopic views of Convection using GOES-16 and GOES-17
GOES-16 (Left) and GOES-17 (Right) Visible (0.64 ) imagery, 1202-1907 UTC on 11 July 2018 (Click to play mp4 animation)
GOES-17 is currently in the test position at 89.5º W Longitude, and GOES-16 is at the GOES-East location at 75.2º W Longitude. This close spacing longitudinally means that stereoscopic three-dimensional views of visible imagery can be produced. The mp4 animation above (Click here for an animated gif) shows convection over the Tennessee River valley from 1202 through 1907 UTC on 11 July 2018 (with some gaps in time when GOES-17 data were not received).
To view the animation in three dimensions, cross your eyes so that three separate images are present. Focus on the image in the middle.
Added, courtesy of Rick Kohrs, SSEC: When you create a Stretched ‘True Color’ image from the first 3 Channels on GOES-16/GOES-17, you can also see the curvature of the Earth in the stereoscopic view!
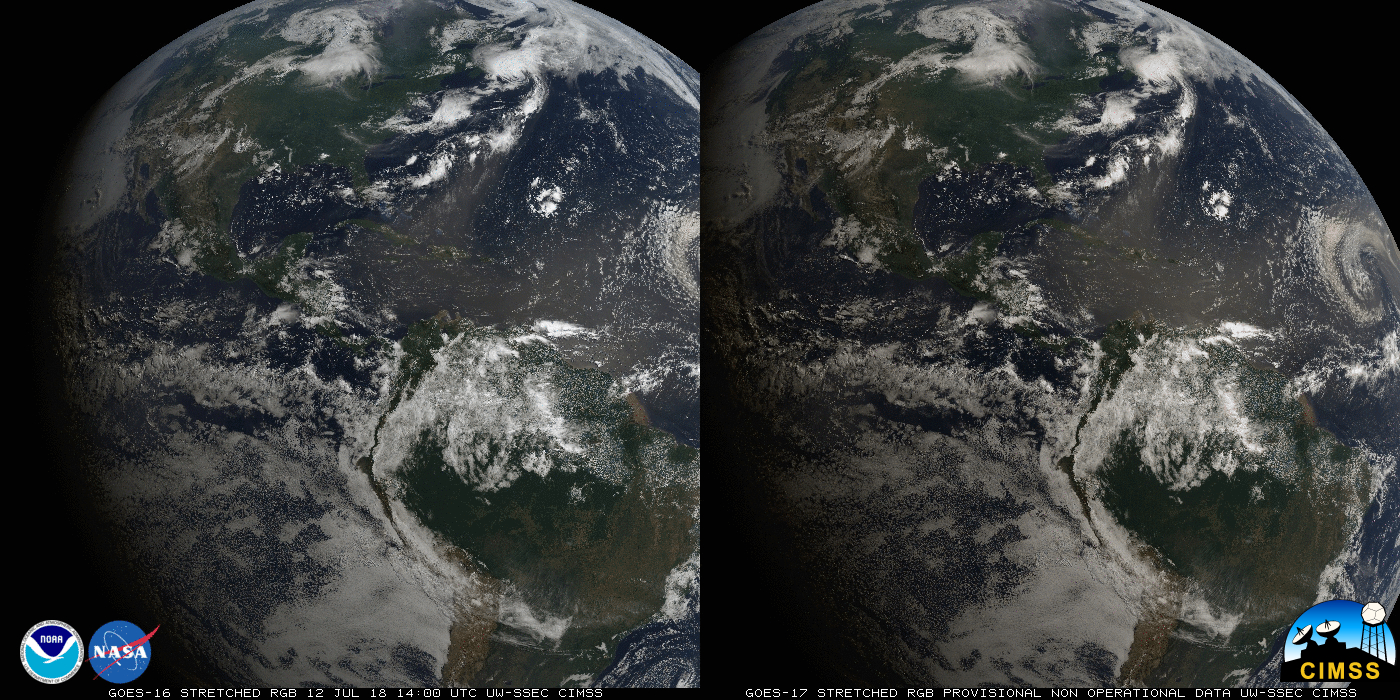
Stretched CIMSS Natural True Color imagery, combining Bands 1-3 on GOES-16 and GOES-17, 1400 UTC on 12 July 2018 (Click to enlarge)
GOES-17 imagery in this blog post is preliminary and non-operational.