Short term weather forecasting from satellite imagery |
||
|
Click on the image to see the
|
|
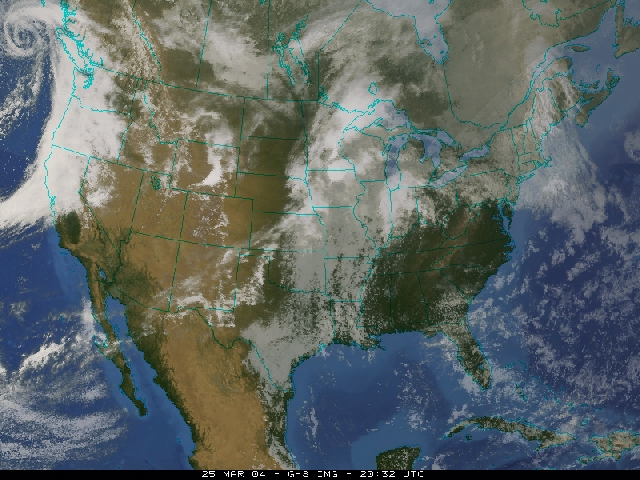
| Along with showing us where the clouds are, this satellite image suggests that precipitation is occurring in the Pacific Northwest and much of the Midwest. You could forecast rain for central California from this image alone, and you'd probably be right. A single satellite image provides a wealth of information. Meteorologists looking at this image could tell where the mild air is, where the cold and warm fronts are, and even identify stormy weather. |
||
Animating Satellite Imagery
There are no movie cameras on satellites, radiometers record digital data and provide snapshots of the Earth and atmosphere. During the 1960s, Dr. Vernor Suomi, the Father of Satellite Meteorology, had an epiphany while watching an instant reply in a football game. It struck him that meteorologists should animate cloud imagery to truly understand the weather. This is why scientists use computers to create continuous loops of satellite imagery.
And while ample knowledge can be inferred from a single satellite image, even more can be deduced from animations.
Can you see the storms marching across the United States?
Station Weather Plots
Satellite images, fronts, isobars, highs and lows show large scale weather features and help us see the big weather picture. However, meteorologists need to look at the weather data
with more detail.
One common
way to look closer at the weather conditions is with station weather plots.
The station weather plot is a graphic of a surface observation with information about precipitation,
cloud cover, wind speed, wind direction, visibility, temperature, dew
point
temperature,
atmospheric pressure, and the change in pressure
over the last three hours.
Below is an example of a surface station
weather plot with labels
explaining the data.
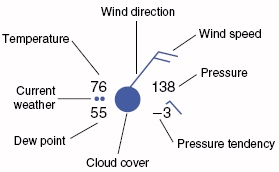
In this station plot, the temperature is 76 degrees Fahrenheit (F), the dew point is 55F, the wind direction is from the northeast at about 20 knots. The pressure is 1013.8 mb. The pressure tendency indicates that the pressure increased then decreased and is now lower by 0.3 mb than three hours ago. The cloud cover is 100% overcast and it is raining. The amount of sky covered by clouds is indicated by the circle in the center of the station plot. Whatever fraction is filled in represents the fraction of the sky that is cloudy for that location.
By combining animated satellite images with a current weather map with surface observations you can forecast the weather with a good degree of accuracy in the short term. You'll have a chance to test your forecasting skills in the activity and assessment sections of this lesson.