Different sensor, different information
There are several types of sensors on satellites. Depending on the oceanic (or other) features a particular sensor is intended to study, it is sensitive to a specific portion of the electromagnetic spectrum. We can take advantage of the different types of sensors available to learn different types of information about ocean surfaces.
Active vs passive sensors
Active sensors provide their own source of energy (like a flash is used to illuminate a scene for a photo).
Passive sensors do not provide a source of illumination; they sense the energy emitted or reflected from a surface.
For satellite remote sensing at visible or infrared frequencies, we typically use the sun for the source of illumination. For microwave remote sensing, both active and passive systems are used.
Sensor sensitivity, application, and limitations
Study the table below where we highlight some of the most important characteristics of satellite-borne sensors.
| Sensor | Wavelength | Information | Limitations | Satellite(s) |
Imaging Radiometer (Passive) |
Visible 400-750 nm |
Ocean reflectance (visible light) |
Can't see through clouds |
GOES IKONOS Landsat |
High Resolution Radiometer AVHRR (Passive) |
IR .7-1000 µm | Sea Surface Temperature (SST) |
Can't see through clouds |
POES IKONOS Landsat |
Radiometer (Passive) (examples: AMSR & SSM/I) |
Microwave .1-100 cm |
Temperature and Roughness |
Low spatial resolution |
TRMM EOS |
Scatterometer (Active) (example: SAR) |
Microwave .1-100 cm |
Sea Surface Roughness |
Image interpretation requires training; can be challenging. Not an imaging system, when image products are produced they typically have low spatial resolution. |
Radarsat QuikSCAT |
Altimeter (Active) |
Microwave .1-100 cm |
Senses distance (or altitude) from satellite to earth | Interpretation of altimeter data can be challenging to untrained interpreter. Not an imaging system, when image products are produced they typically have low spatial resolution. | TOPEX / POSEIDON |
Models link satellite observations to earth-based observations |
|
|
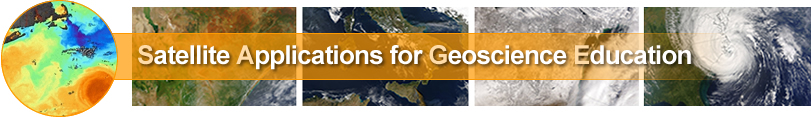
To understand remote observations of ocean conditions, it’s necessary to create mathematical models that relate the indirect, satellite-based observations of ocean phenomena (e.g. sea surface temperature, wind speed) to direct measurements of the same quantities, also known as ‘ground truth.’ The models express how the two data sets are related. |
 Click on the image above to compare satellite derived Gulf Stream temperatures to buoy measurements |
|
Some limitations of ocean models
Keeping these limitations in mind we can still relate space-based and ‘ground truth’ measurements obtained from the same place at the same time. |
|
Adjusting models with ground truth |
|
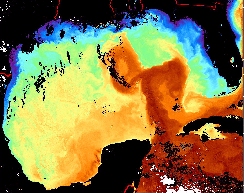
 Click on the image above to learn more about aligning models with ground truth |
Models must be accurate or else the space-based data will be of limited use. Ground truth is often used to check or validate the accuracy of these mathematical models. When atmospheric or oceanic conditions are encountered that are very different from the conditions corresponding to the ground truth data used to develop a particular model, then the accuracy of the model will not be very good. Sometimes this can be a significant problem, as in the examples you can explore by clicking on the image to the left. |
Spectral and Temporal Comparisons |
|
|
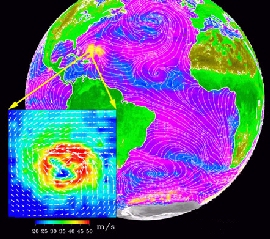
Want to find evidence for natural or human-induced changes in ocean areas? Views of the same area collected with different sensors or at different times can be used to show the effect of events like tsunamis, by comparing images acquired before and after the event, and also for tracking the movement of major ocean currents like the Gulf Stream, identifying evidence of seasonal warming of water, or identifying runoff from land into water due to intense storms or human activity. The example on the right enables us to use images acquired at different times to track the location of the Gulf Stream, and also to see how different a particular ocean feature appears when viewed by sensors at different frequencies. |
 Click on the Image above to track the Gulf Stream |