|
Comments, questions on this web page? Send e-mail to:
Chian-Yi Liu
|
ABS/HES Simulation
Contents
Introduction
Simulation Based on AIRS Data
Simulation Based on NAST-I
Data
Introduction
There are two main methods to simulate the expected signal for a
future instrument. One method uses a radiative transfer model along
with some estimate of the state of the atmosphere to calculate the
expected (noise free) signal and then add noise. The second method,
employed in this web page, is to use higher-resolution data to simulate
ABS/HES. This method allows for more realistic simulations, especially
of the clouds. We use the high-resolution AIRS and NAST-I data
to simulate ABS/HES bands
The following set of AVI-format animations were created at the
Cooperative Institute for Meteorological Satellite Studies (CIMSS)
to demonstrate the need for high spectral resolution satellite
data. The current GOES Sounder has 18 infrared channels and the
proposed ABS/HES would be a high spectral resolution instrument
covering the following wavelengths:
| Waveband (cm-1) |
Unapodized Spectral Resolution (cm-1) |
| 650 - 1200 |
0.625 |
| 1210 - 1740 |
1.25 |
| 2150 - 2720 |
2.5 |
Simulation Based on AIRS Data
The following animations show a sample of the data which would be
available from the proposed ABS/HES. These were created using AIRS
level1b data set on July 20, 2002, 19:20 UTC. To simulate ABS/HES,
all good quality AIRS IR channels are chosen in the proposed ABS/HES
wavebands.
Longwave, Midwave, and Shortwave Bands
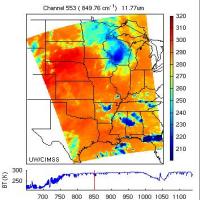
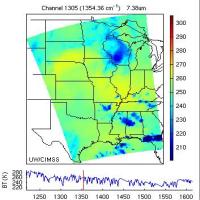
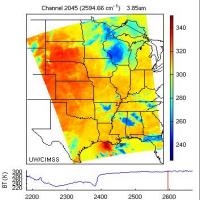
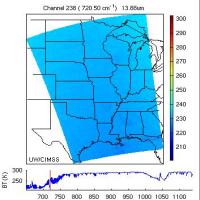
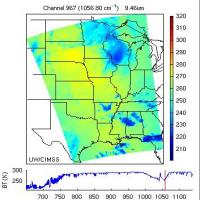
The following animation shows the AIRS radiances converted to brightness
temperatures (Kelvin) which simulates what will be seen with the
ABS/HES longwave (650 - 1200 cm-1), midwave (1210 - 1740
cm-1) and shortwave (2150 - 2720 cm-1) spectral
regions.
Longwave
650 - 1200 cm-1
(~41.5MB, 1102 frames) |
Midwave
1210 - 1740 cm-1
(~24.2MB, 540 frames) |
Shortwave
2150 - 2720 cm-1
(~18.1MB, 464 frames) |
 |
 |
 |
(Click to view in browser or right-click and
choose "Save Link As..." to download)
Note: The image on the top of the animation displays
the AIRS radiances converted to brightness temperatures (Kelvin)
which simulates what will be seen with the ABS/HES. The figure
on the bottom displays FOV-mean brightness temperature and the
red line indicating the current band shown on the top.
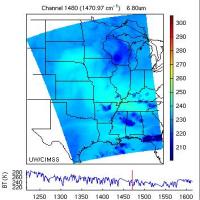
CO2, O3 and HO2 Bands
The size of the AVI-format movie files is rather large, the bands
in the carbon dioxide (690 - 790 cm-1), ozone (980 - 1080
cm-1) and water vapor (1450 - 1550 cm-1) are
extracted to reduce download time.
CO2 Band
690 - 790 cm-1
(~17.8MB, 291 frames) |
Ozone Band
980 - 1080 cm-1
(~11.6MB, 177 frames) |
Water Vapor Band
1450 - 1550 cm-1
(~7.6MB, 101 frames) |
 |
 |
 |
(Click to view in browser or right-click and
choose "Save Link As..." to download)
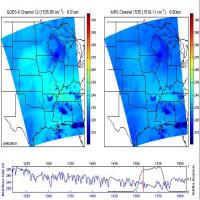
GOES-8 Sounder Band 12 and Corresponging AIRS Bands
The following AVI movie shows AIRS high-resolution measurement with
the GOES-8 band 12 (around 6.7µm water vapor) band.
Water Vapor 6.7µm Band
1435 - 1640 cm-1
(~22.7MB, 197 frames) |
 |
(Click to view in browser or right-click and
choose "Save Link As..." to download)
Note: The image on the right side of the animation displays
the AIRS radiances converted to brightness temperatures (Kelvin)
which simulates what will be seen with the ABS/HES. The image on
the left side displays AIRS radiances convolved over the current
GOES-8 Sounder spectral response function for the appropriate band
and converted to brightness temperatures (Kelvin).
Simulation Based on NAST-I Data
(October 17, 2000)
Longwave, Midwave, and Shortwave Bands
The following animations show a sample of the data which would be
available from the proposed ABS/HES. These were created using high
spectral resolution (~0.25 cm-1) NAST-I data. The NAST-I
instrument was flown over Oklahoma on March 19, 2000; click here to
see the flight path. To simulate ABS/HES, the spectra shown is sampled
every 3 NAST-I data points for the longwave, every 5 for the midwave,
and every 10 for the shortwave. The animations only display a data
point every 5 cm-1; this is done to maintain a reasonable
animation file size. Subsequently, this only simulates every 8th
ABS/HES data point in the longwave, every 4th in the midwave, and
every 2nd in the shortwave.
Longwave (~14 Mb)
650 - 1200 cm-1 |
Midwave (~11 Mb)
1210 - 1740 cm-1 |
Shortwave (~14 Mb)
2150 - 2720 cm-1 |
 |
 |
 |
(Click to view in browser or right-click and
choose "Save Link As..." to download)
Note: The image on the right side of the animation displays
the NAST-I radiances converted to brightness temperatures (Kelvin)
which simulates what will be seen with the ABS/HES. The image on
the left side displays NAST-I radiances convolved over the current
GOES Sounder spectral response function for the appropriate band
and converted to brightness temperatures (Kelvin). These images
are centered over Oklahoma.
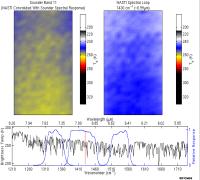
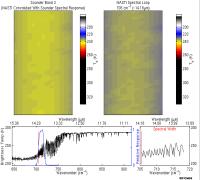
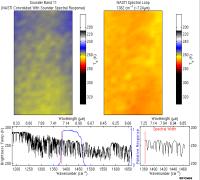
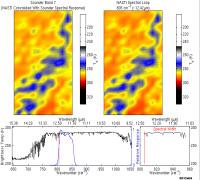
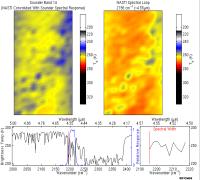
Sounder Bands 3, 7, and 11
For a more dramatic demonstration, Sounder bands 3, 7, and 11 were
isolated to show how much spectral variability in the atmosphere
exists within those bands which is currently being averaged over
using the Sounder. To maintain a manageable file size, band 7 was
sampled at every ~1.0 cm-1 and band 11 was sampled at
every ~1.25 cm-1. Band 3 is shown at the NAST-I spectral
resolution, which is approximately 0.24 cm-1 for this
data set.
Sounder Band 3 (~6.4 Mb)
705 - 718 cm-1 ~14µm |
Sounder Band 7 (~10.8 Mb)
805 - 855 cm-1 ~12µm |
Sounder Band 11 (~10.2 Mb)
1382 - 1464 cm-1 ~7µm |
 |
 |
 |
(Click to view in browser or right-click and
choose "Save Link As..." to download)
Note: The image on the right side of the animation displays
the NAST-I radiances converted to brightness temperatures (Kelvin).
The image on the left side displays NAST-I radiances convolved
over the current GOES Sounder spectral response function for the
appropriate band and converted to brightness temperatures (Kelvin).
Special Note: These animations were resized on November
30, 2000 to be 720x544 pixels, which may facilitate viewing in
a Powerpoint slide.
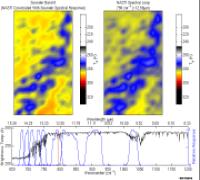
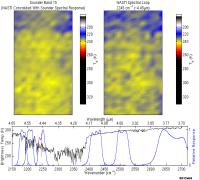
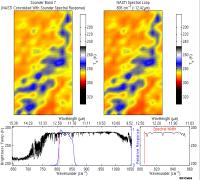
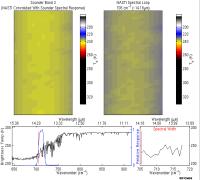
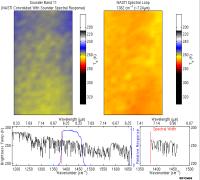
Sounder Bands 3, 7, 11, and 14 at ABS/HES Spectral Resolution
In the following animation demonstrations Sounder bands 3, 7, 11,
and 14 are shown at the spectral resolutions planned for ABS/HES.
This is ~0.625 cm-1 for bands 3 and 7, ~1.25 cm-1 for
band 11, and ~2.5 cm-1 for band 14.
Sounder Band 3 (~2.1 Mb)
705 - 718 cm-1 ~14µm |
Sounder Band 7 (~14.2 Mb)
805 - 855 cm-1 ~12µm |
 |
 |
Sounder Band 11 (~10.0 Mb)
1382 - 1464 cm-1 ~7µm |
Sounder Band 14 (~1.9 Mb)
2196 - 2217 cm-1 ~4.5µm |
 |
 |
(Click to view in browser or right-click and
choose "Save Link As..." to download)
Note: The image on the right side of the animation displays
the NAST-I radiances converted to brightness temperatures (Kelvin)
which simulates what will be seen with the ABS/HES. The image on
the left side displays NAST-I radiances convolved over the current
GOES Sounder spectral response function for the appropriate band
and converted to brightness temperatures (Kelvin).
Special Note: These animations were resized on November
30, 2000 to be 720x544 pixels, which may facilitate viewing in
a Powerpoint slide.
Full IR Spectra (January 11, 2001)
The following AVI animation shows the spectrum from 650 cm-1 to
2650 cm-1 sampled at 5 cm-1 intervals. This
is the whole IR spectral width for NAST-I when it was flown at ~51,000
feet over Oklahoma on March 3, 2000 during ARM CLOUD IOP. This is
the same NAST-I dataset as used in the animations above, focused
on a different section of the flight path. The bottom, or earlier,
part of this section of the flight path was over a cloudy scene and
the top, or later, part of this section of the flight path was over
relatively clear sky. The image is 5 pixels wide by 49 pixels long,
which is roughly equal to a 15 by 150 km area. Note that the swath
width is 13 pixels and this image only shows the middle 5 pixels;
this is so limb effects are not seen in the images. On the images
themselves there are 2 marks, a blue and a red x. The blue x marks
the pixel location of the cold, or cloudy, spectrum shown below the
image (blue line) and the red x marks the pixel location of the warm,
or clear, spectrum shown below the image (red line). The blue x is
located at 35.3084 N and 96.2817 W at approximately 18:37 UTC. The
red x is located at 35.0888 N and 96.9296 W at approximately 18:46
UTC.
Infrared Spectrum (~20 Mb)
650 - 2650 cm-1 or ~15.4 - 3.8µm |
 |
|